Docs / Data Management
Metrics
Metrics are the numbers behind every widget and dashboard in Indicate. This article explains what a metric is, where the numbers come from, how metrics relate to data products, and what to check when a value looks wrong.

What is a metric?
A metric is a single, named measurement, for example Total Revenue, Occupancy Rate, or Total Reservations. Every metric is a definition: it defines which fields to read from the source, how to filter them, and how to aggregate the result.
Metrics are what you select when you build a widget or a dashboard. You don't query the raw data directly, you query a metric, and the metric returns the same answer every time, no matter who asks or where it is displayed.
The same principle applies outside the app: when you create an API token in Indicate and connect it to an external tool, for example an AI assistant via MCP, a BI tool, or a custom integration, that tool also queries metrics, not the raw underlying data. The AI sees the same governed numbers you see in your dashboards, with the same definitions applied. This keeps results consistent across every surface and prevents external tools from interpreting your raw data differently.
The numbers you see in Indicate mirror your source system. Indicate does not invent or re-interpret data. We read what your PMS, analytics tool, or CRM delivers through its interface, apply the metric definition, and return the result. If a value looks unexpected, the cause is almost always in the source system or in how the field is defined there.
Previewing a metric
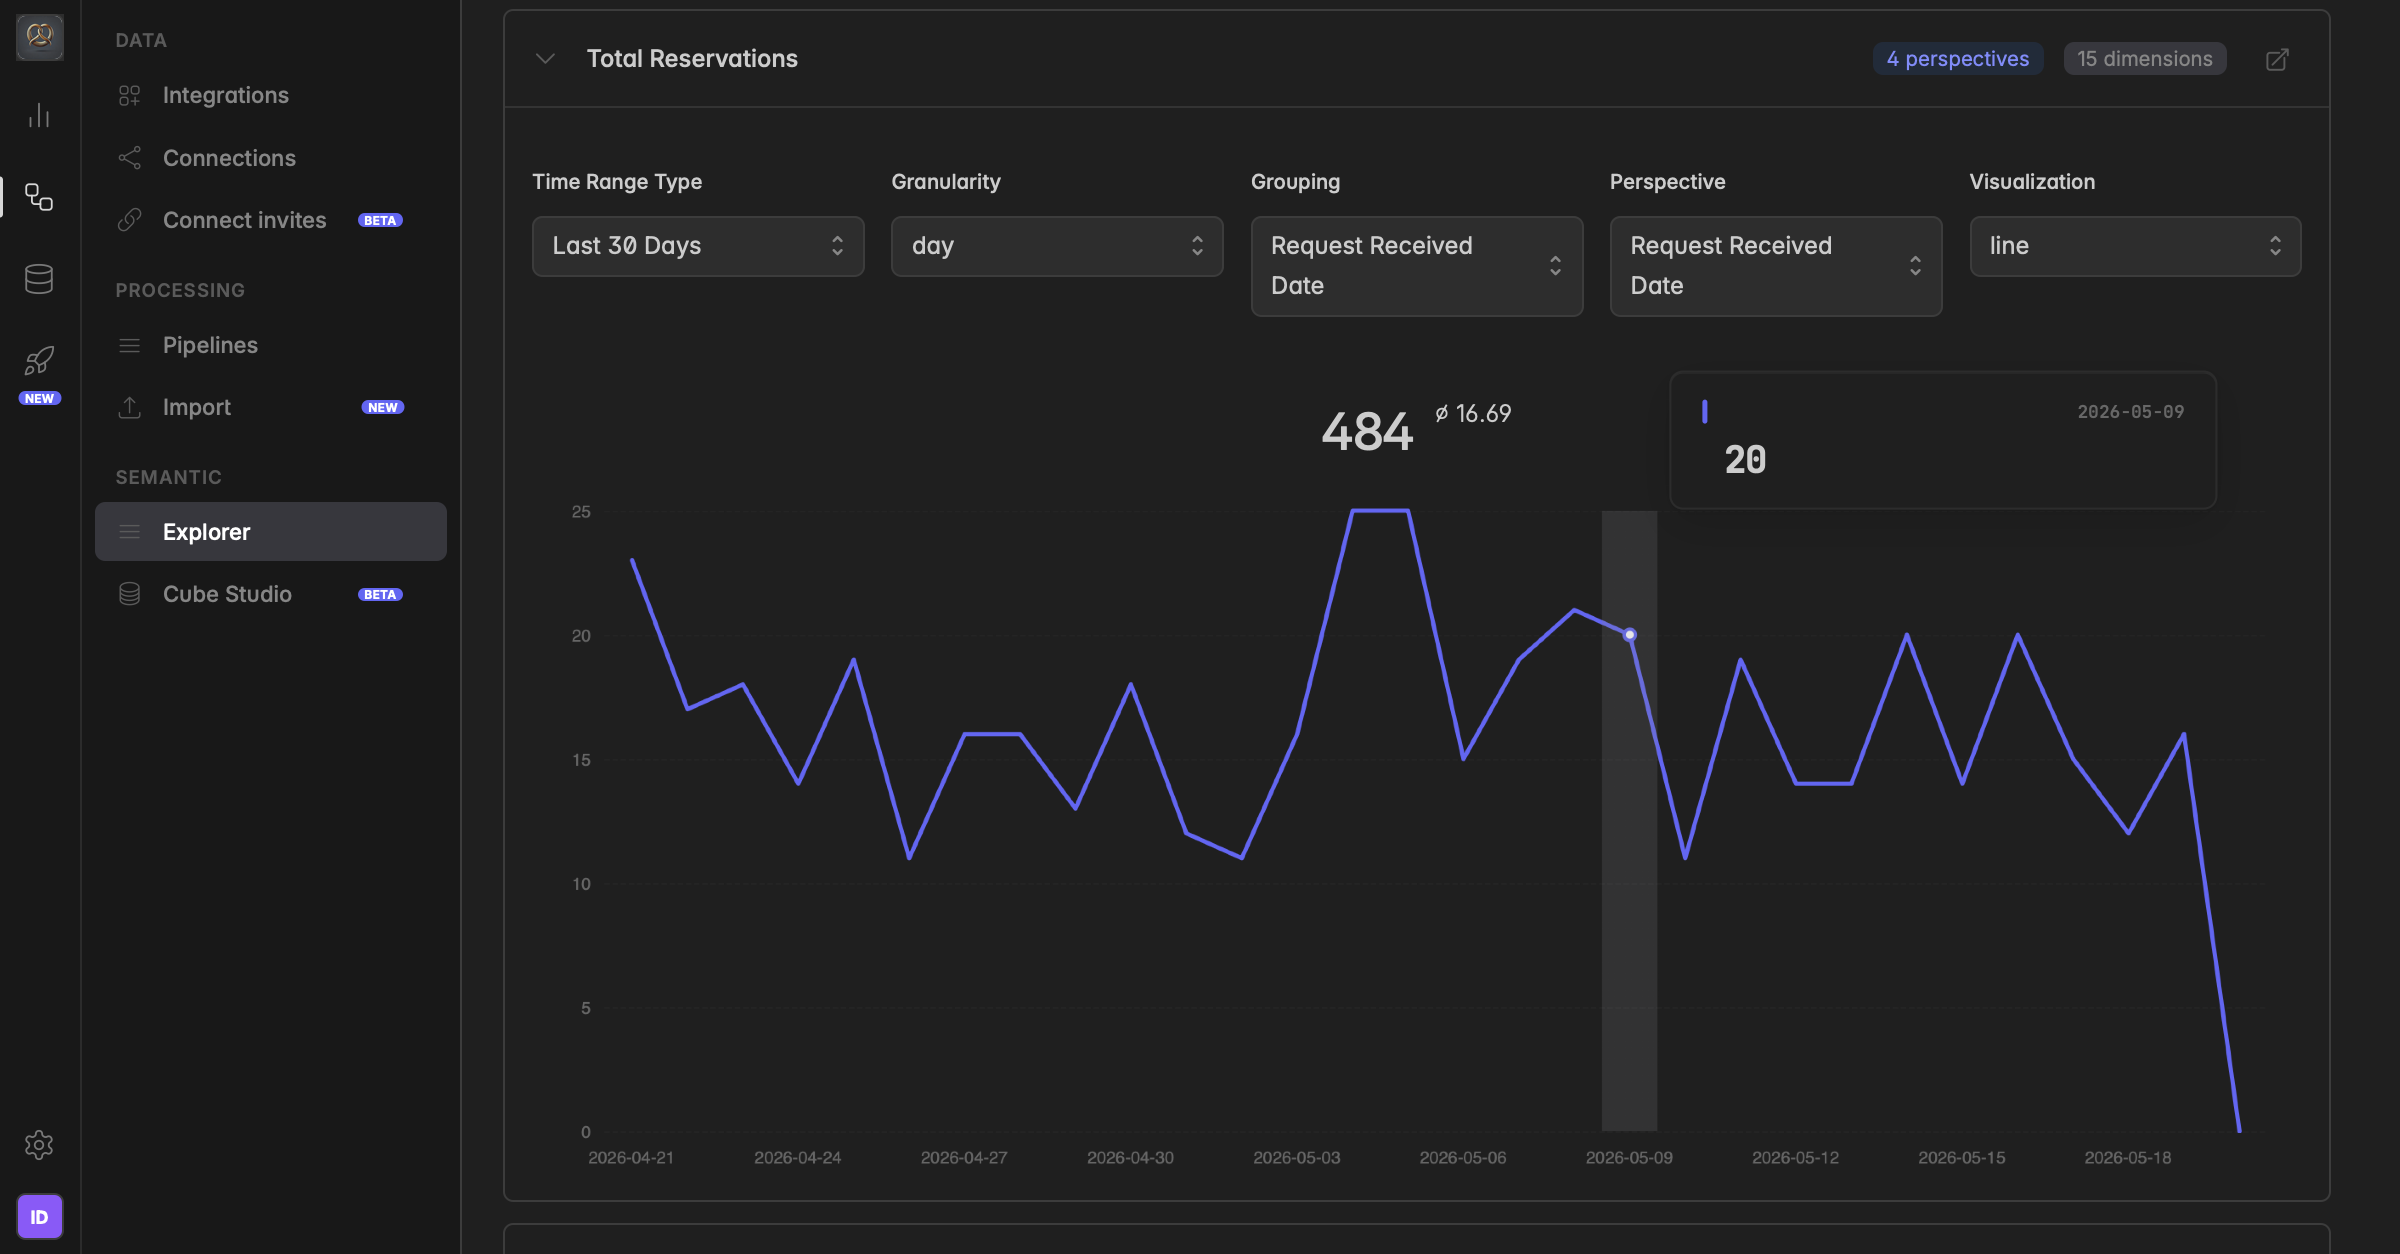
Every metric in the Explorer has a built-in preview. Click on a metric to expand it, and a chart with the metric's current values appears directly inline.
By default the preview shows the last 30 days. You can change Time Range, Granularity, Grouping, Perspective, and Visualization right inside the preview to explore how the metric behaves.
The preview is a preview, not a saved view. As soon as you close the metric, all changes you made (time range, perspective, dimensions, etc.) are reset. To keep a specific view, add the metric to a dashboard or save it as a widget instead.
Some metrics only contain values in the future (for example forecasted occupancy or interfaces without historical data) and show no data for past dates. For those, switch the Time Range from “Last 30 Days” to a future window so the preview can return results.
How metrics relate to data products
Metrics never live on their own, they always belong to a data product. A data product is the container; the metrics are what's inside it.
A data product defines the scope: which integration, which dimensions, which metrics belong together.
A metric defines a single number inside that scope.
When you build a widget, you first pick the data product (the cube), then the metric (the measurement) you want to display. For more on the container layer, see → Data products.
Where do the numbers come from?
Every metric is connected to a pipeline or upload that pulls data from one specific source connection, for example your ReGuest account or your Matomo property. The pipeline writes raw data into your warehouse, and the metric definition tells Indicate how to turn that raw data into a single number.
This has two important consequences:
What we receive is what you see. If a record exists twice in the source, it appears twice in Indicate. If a field is empty in the source, it is empty here.
Interfaces sometimes deliver data differently from what the source UI shows. A common example: we receive revenue without VAT from the PMS interface, while the PMS UI displays revenue including VAT. Both numbers are correct, they just describe different things. If you are unsure how a specific field is delivered, reach out to support.
Managed vs. custom metrics
There are two kinds of metrics in Indicate:
Managed metrics
Pre-built by Indicate for each supported integration. These cover the standard KPIs (revenue, occupancy, sessions, conversions, etc.) and are maintained by us.Custom metrics
Defined by you or your agency or your own team on top of any data product. Use these for KPIs specific to your business, derived calculations, or measurements the managed product does not expose out of the box.
Can I build my own metrics?
Yes. You can define custom metrics on top of any data product. This is covered in detail under Advanced.
Troubleshooting
Why are my metrics not correct?
This is the most common issue we see, and it almost always reflects how categories or records are set up in your source system. The Data Studio shows exactly what we receive from your source system, so if a record is created twice in the source, it appears twice here.
Typical examples from hotels:
Room categories created twice. If you set up your garage as a separate room category, or you have two rooms that can also be sold as a connecting unit under a third category, you end up with one room too many in the data. This breaks your occupancy and ADR calculations, because the same physical room is counted multiple times.
Virtual room categories. A double room exists as “Double Room” in the PMS and is also listed as “Double Room for Families”. From our perspective these are two categories, but it is the same physical room. We often receive both from the PMS without any indication that they are linked. We cannot tell them apart, so the data looks wrong even though it is exactly what your source system delivers.
Reservations entered under two profiles. The same guest or booking is created twice, for example once as a walk-in and once via a channel, and both records flow into the Data Studio.
What to do
There are two places where the fix can sit, depending on the cause:
The fix in Indicate.
It can happen that a metric is defined incorrectly, for example the wrong aggregation (a mean instead of a sum) or the wrong fields are being summed. In that case the source data is fine, but the metric definition needs to be adjusted. Open the metric in the data product and review or update its definition.
The fix in the source system. When duplicates or missing values come from the PMS itself, no metric change in Indicate will fix it — the cleanup has to happen at the source. Keep your PMS clean and consistent:
Maintain clear room categories and document which rooms are open, which are closed, and which categories actually exist as physical rooms versus virtual or sales-only categories.
Avoid duplicate categories for the same physical room.
Review your category list regularly and remove or merge anything outdated.
Inconsistent values across interfaces
Some interfaces also deliver data differently than what you see in your source system. A common case: we receive revenue without VAT from the interface, while your PMS displays revenue including VAT. The numbers will not match at first glance, but both are correct, they just describe different things.
Another common case is timing. Some PMS systems split a booking across the nights of the stay in their own UI. A 5-night stay shows revenue on each of the 5 days. But the interface to Indicate often delivers the full amount on the billing day (typically check-out), not spread across the stay. The result: in the source system the revenue looks evenly distributed, while in Indicate it can look as if there is no revenue for several days and then a large spike on the billing day. Both views are correct, they just describe the same booking from different angles (per-night vs. per-bill).
Take the time to understand what each field actually contains and how the source system defines it. If you are unsure how a specific field is delivered, reach out to support.
Free text or inconsistent values
The Metric mirrors your source system. If a field is a free-text field in your PMS, please do not wonder why there are many typos in the answers. The same applies to fields that are not mandatory in the source: if you want to analyse the data but the field is not mandatory, many entries might be empty and you will not be able to analyse them.
Fix the data discipline at the source. The cleaner the input, the more reliable every metric on top of it.
Data is missing entirely
If a metric shows no values at all, there are usually two possible causes.
The module is not in use in the source system. The metric depends on a feature, module, or product area that you do not use, have not booked as part of your source subscription, or have not set up yet. In that case the source simply does not generate the underlying data — so there is nothing for Indicate to pull. Check in your source system whether the relevant module is active, configured, and producing data.
PII has been disabled for the source connection. When the PII toggle is off, Indicate does not pull personal or person-related data from the source, so metrics that depend on those fields stay empty — the data is simply not stored.
To check this, go to
Engineering→Connections→Source Connectionsand open the relevant connection. Review the PII toggle and turn it on if you want personal data to be ingested.
Was this helpful?