
Docs / Widgets
Reference lines
Add reference lines such as targets, limits, or averages, and configure their key, type, level, extent, slope, polarity, color, and shape.
Add reference lines
Reference lines let you add constant or dynamic markers to your chart, for example, to visualize targets, limits, or average values. They can be static (Constant) or dynamic (Linear), allowing you to mark single thresholds or visualize evolving reference paths across time.
They allow you to:
Add context and meaning to your visualizations.
Mark targets (e.g., goal = 10,000 users).
Set warning thresholds (e.g., error rate should stay below 2%).
Visually separate performance zones.
By defining clear thresholds, you make dashboards easier to interpret and communicate goals across teams.
Reference lines do not affect your data, they serve as visual context.
You can add multiple references per chart and adjust their behavior precisely.
Each reference line can be styled and named individually.
How do I add a reference line?
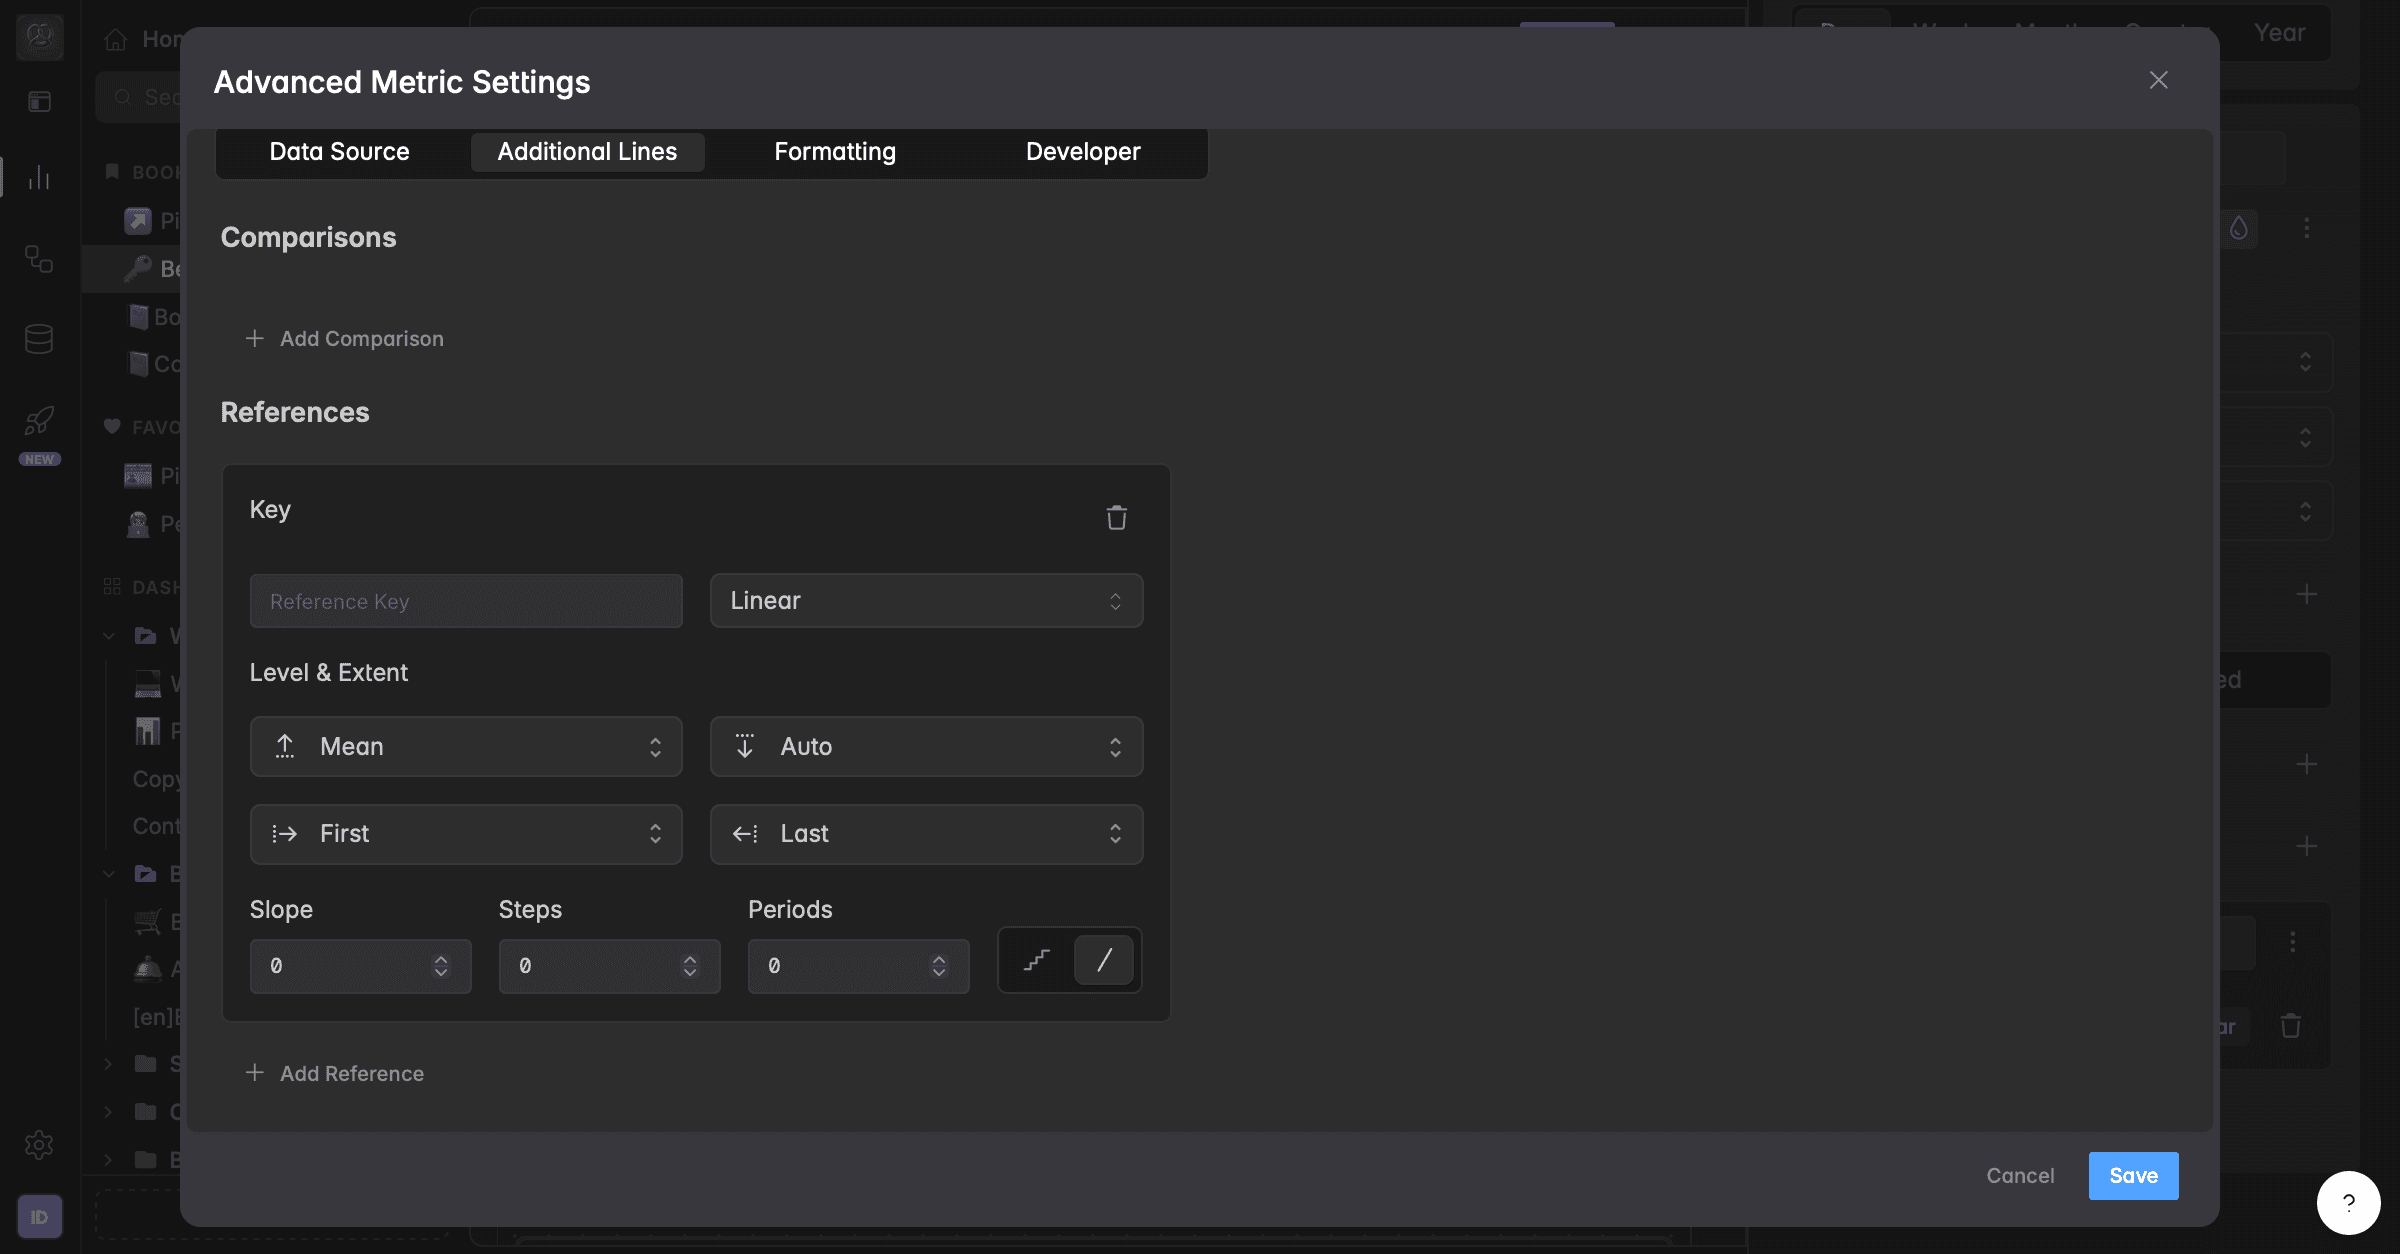
Reference lines live under Advanced Metric Settings, in the Additional Lines tab. Open that panel, add a reference, and configure it in this order:
Open your dashboard.
Select your widget.
Scroll to the Reference Lines section and click
+.Define a Reference Display name wich is also your Reference Key: a name for the reference (for example Monthly Budget). The Key also lets you link a Comparison to this line.
Assign a Color.
Open Advanced Metric Settings
⋮to fine-tune your reference. Here, you can:Set the Reference Type → Constant or Linear.
Adjust Level & Extent: where the line sits and how far it runs.
Customize Slope, Steps, and Periods for precise control over how the line behaves.
Choose the visualization: a line or a staircase.
Click Save to apply your settings.
The sections below explain each setting.
What do Constant and Linear mean?
When creating a reference, you can choose between two Reference types:
Constant
A fixed horizontal line at a specific value → ideal for targets or limits.
Example: Show a line at 10,000 users as your monthly goal.
Linear
A dynamic reference that connects two or more points → great for showing trends, goals over time, or projected change.
Example: Create a line that increases linearly from your first to last time period.
You can change the Reference type in the dropdown menu when adding or editing a reference.
Level & Extent for reference lines
The Level & Extent section defines where your reference line starts and ends, and what values it uses.
Level (Y-axis position)
Level sets the value of the line on the y-axis (its vertical position):
Available settings:
Level | The line sits at |
|---|---|
Zero | the value 0. |
Mean | the average of all data points. |
Median | the middle value of the data. |
Min | the lowest value in the data. |
Max | the highest value in the data. |
Auto | a value Indicate picks automatically from the current chart. |
Fixed | a constant value you type in. |
Percentile | a chosen percentile, for example the 90th percentile. |
First | the first data point's value. |
First (Non-Null) | the first data point that actually has a value, skipping empty points. |
Last | the last data point's value. |
Last (Non-Null) | the last data point that actually has a value, skipping empty points. |
Extent (X-axis range)
Extent sets where the line starts and ends along the x-axis (its horizontal range):
Extent | The line runs |
|---|---|
Auto | across the chart automatically. |
First | starting at the first visible point. |
Last | ending at the last visible point. |
Fixed | between a start and end you define. |
Offset | shifted forward or backward by a number of periods. |
This allows you to build, for example, a linear reference that connects the mean of your first data point to the max of your last data point, perfect for goal trends or baselines.
A Constant line usually needs only a Level. A Linear line uses Level and Extent together to set its start and end, for example connecting the Mean of the first point to the Max of the last.
What do Slope, Steps, and Periods do?
Below the Level & Extent settings, you’ll find options to fine-tune how your reference behaves. These fine-tune a Linear reference line:
Slope: the incline of the line. A positive slope rises across the chart and a negative slope falls, so the line shows a steady increase or decrease instead of staying flat.
Steps: how many increments the line is calculated in. More steps make a smoother climb; fewer steps make a more visibly stepped progression.
Periods: shifts the line forward or backward by a number of time periods. Useful for forecasts or for lining the reference up with a lagged target.
What does Polarity mean?
Polarity tells Indicate which direction counts as good, so it can color performance and judge whether you are on track:
Maximize: higher is better (for example Revenue or Users). Values above the line are good.
Minimize: lower is better (for example Error rate or Bounce rate). Values below the line are good.
Hit: the goal is to land on the line exactly (a target you want to reach).
Avoid: the line is a limit you should not cross. Stay on the safe side of it.
How do I change a reference line's color and shape?
Each reference line has its own color and shape so it stands out from your data series and comparison lines.
Color: click the color droplet next to the reference line and pick a color.
Visualization: choose a line for a straight or sloped line, or a staircase for a stepped shape.
Troubleshooting
My reference line disappeared during a presentation.
It may be ghosted. Ghosting hides a reference line but keeps it saved. Open the widget builder, go to Reference Lines, and un-ghost it by clicking the little ghost symbol.
My Comparison can't find the reference.
A Comparison links to a reference line through its Key. The Key in the Comparison must exactly match the Key on the reference line, including spelling and capitalization. Select the Key from the drop down menu.
Was this helpful?