
Docs / Widgets
Manage widget data sources & Metrics
Add, change, combine, and remove the data sources behind a widget, and swap the metric it shows, without rebuilding it.
What is a data source?
A data source is an external system or platform connected to Indicate, such as Google Analytics 4, a PMS, or a CRM. Each widget pulls its data from one or more data sources you select when you create or edit the widget. A data product is a collection of metrics from a data source. A metric (KPI) is the smallest unit and metrics are grouped into data products.
Only connected sources appear in the data source dropdown. To see what is connected, open
My Data Sources. To connect a new one, go toEngineering→Marketplace.
How do I add a data source to a widget?
Open your dashboard
Click
+ Add Widgetin the top right cornerIn the Add new Block to Dashboard dialog, click the
Data SourcedropdownSelect the data source you want to use
Select a
Metricfrom the available options for that data sourceOptionally set a Group by dimension and a Record Time to control how your data is grouped and filtered over time
Click
Save. The widget loads on your dashboard with data from the selected source.
How do I change a widget's data source?
You can switch a widget's data source at any time, without rebuilding the widget.
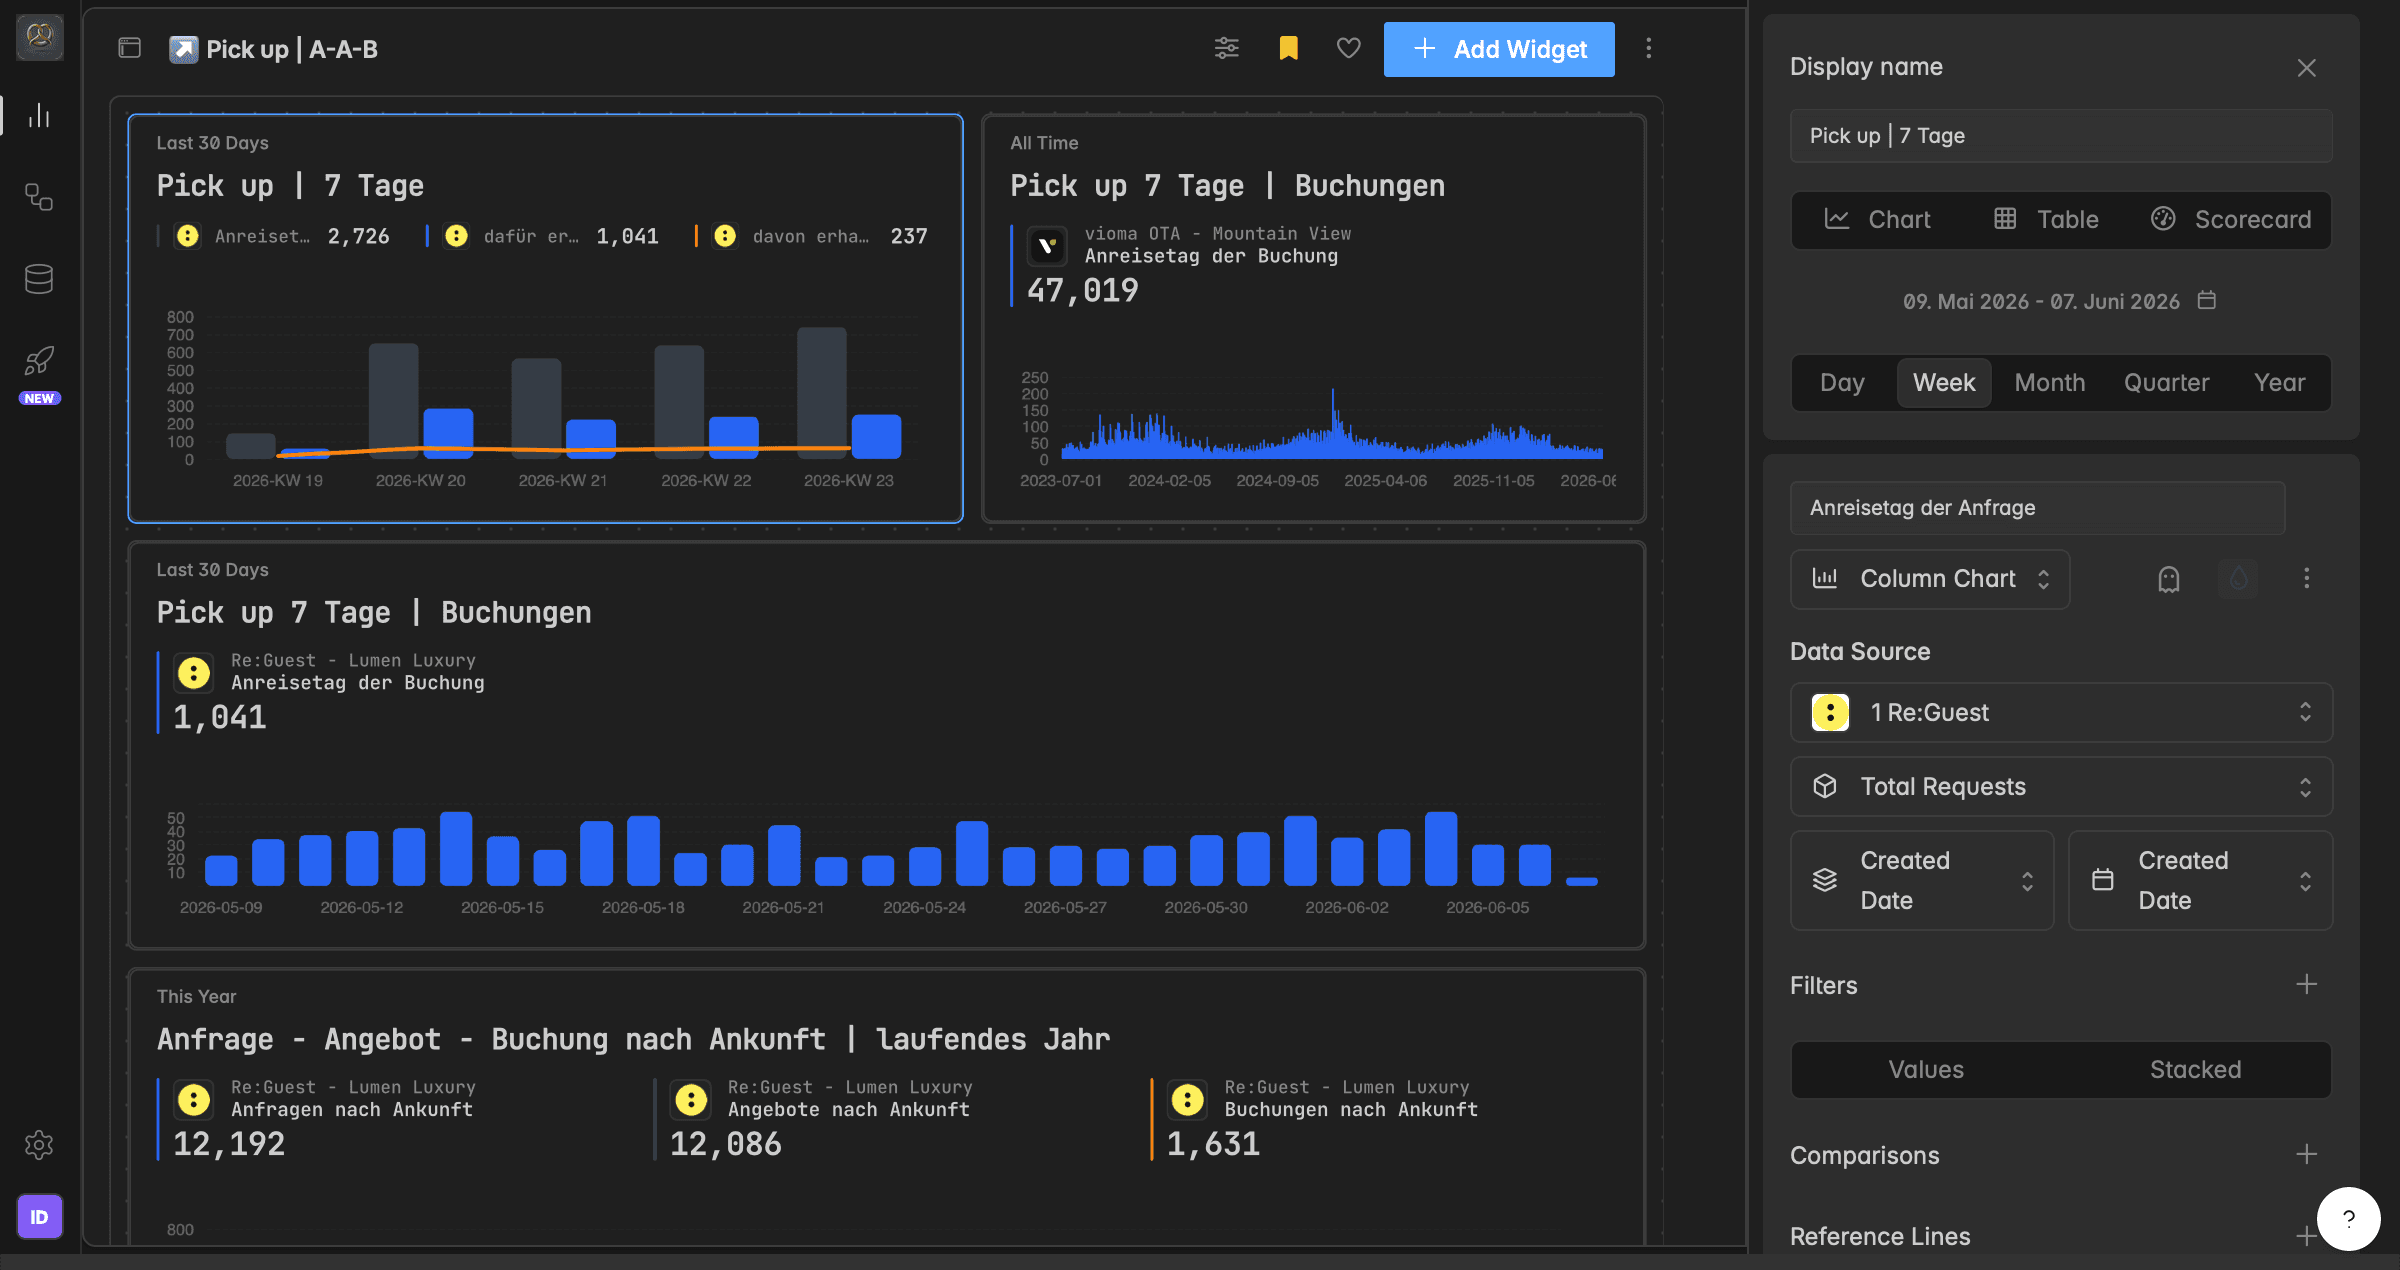
Click the widget you want to edit
The widget designer opens in the sidebar on the right
In the Data Source section, click the dropdown and select a different source
Adjust Metric, Group by, and Record Time if needed
When you change the source, some widget settings such as metrics, filters, or dimensions may automatically update or reset, depending on the new source's structure.
How do I change a widget's metric/KPI?
The metric is the dataset behind the widget, for example Website Views, Revenue Overview, or Ad costs. Change it to reuse the same widget design and chart type with a different dataset.
Click the widget you want to edit.
In the widget builder, locate the Metric section under the data source.
Click the current Metric name.
Select a different Metric from the dropdown. Use the search bar to find one quickly.
Review the assigned Metric, dimensions, and Group by, and adjust them if the new product uses different field names.
The widget preview updates automatically.
Changing the metric or data product keeps your layout, filters, and chart type. If the new product uses a different schema, some fields may need manual reassignment.
How do I combine multiple data sources in one widget?
You can combine several data sources in one widget, for example to compare Google Analytics traffic against PMS reservations in the same chart.
Click the widget you want to edit.
In the widget builder, scroll to the bottom of the Data Source section.
Click the
+ buttonto add another data source block.Configure the new source with its own Metric, Group by, and Record Time.
How do I remove a data source from a widget?
There are two ways to remove a data source, depending on what you want to keep.
Remove a single Metric (keep the widget)
Use this when a widget has multiple Metrics and you only want to remove one.
Click the widget to open the widget builder.
Locate the Metric block you want to remove.
Click the
⋯icon next to the data source.Select Delete.
If you remove the only data source of a widget, the widget stays on the dashboard but appears empty. You can add a new source or delete the widget.
Remove the entire widget
Use this when you want to delete the widget completely, including all its sources.
Click the widget to open the widget builder.
Scroll to the bottom of the sidebar.
Click the
trash iconnext to Advanced Block Options.
Troubleshooting
I don't see any data, or only zeros
First, adjust the time range. Set the widget to All time and check whether any data appears. If you still see nothing, the issue might be in the source system, not in Indicate. Open your source system and confirm that data exists for the metric and period you are looking at.
If you have access (Admin), you can also check whether the pipeline is healthy in Engineering → Pipelines.
If the metric is part of an add-on in your original source, make sure you have the add-on package enabled.
If you just connected the data source, it can take up to 72 hours for data to load into Indicate, depending on the integration partner.
A data source is missing from the dropdown.
Only connected sources appear in the dropdown. Open My Data Sources to check whether the source is connected. To connect a new one, go to Engineering → Marketplace. If you do not have access, ask your workspace admin.
I get the error message “No series configured” but everything seems fine.
This usually happens when the widget has filters set from a previous metric or data source. If you swapped the data source or metric, open the widget builder and review or clear the widget filters, then re-apply filters that exist for the new selection.
Multiple sources show contradictory numbers.
This usually reflects how each source actually records data. A common example: your online booking engine only sees direct online bookings, while your PMS also includes walk-ins and phone reservations. The PMS will always show more reservations. Check how each source defines and captures the metric before comparing.
Was this helpful?