
Grouping and perspective
Grouping controls how data is displayed (e.g., by date or channel), while Perspective determines which data is filtered and included (e.g., by created date or arrival date).
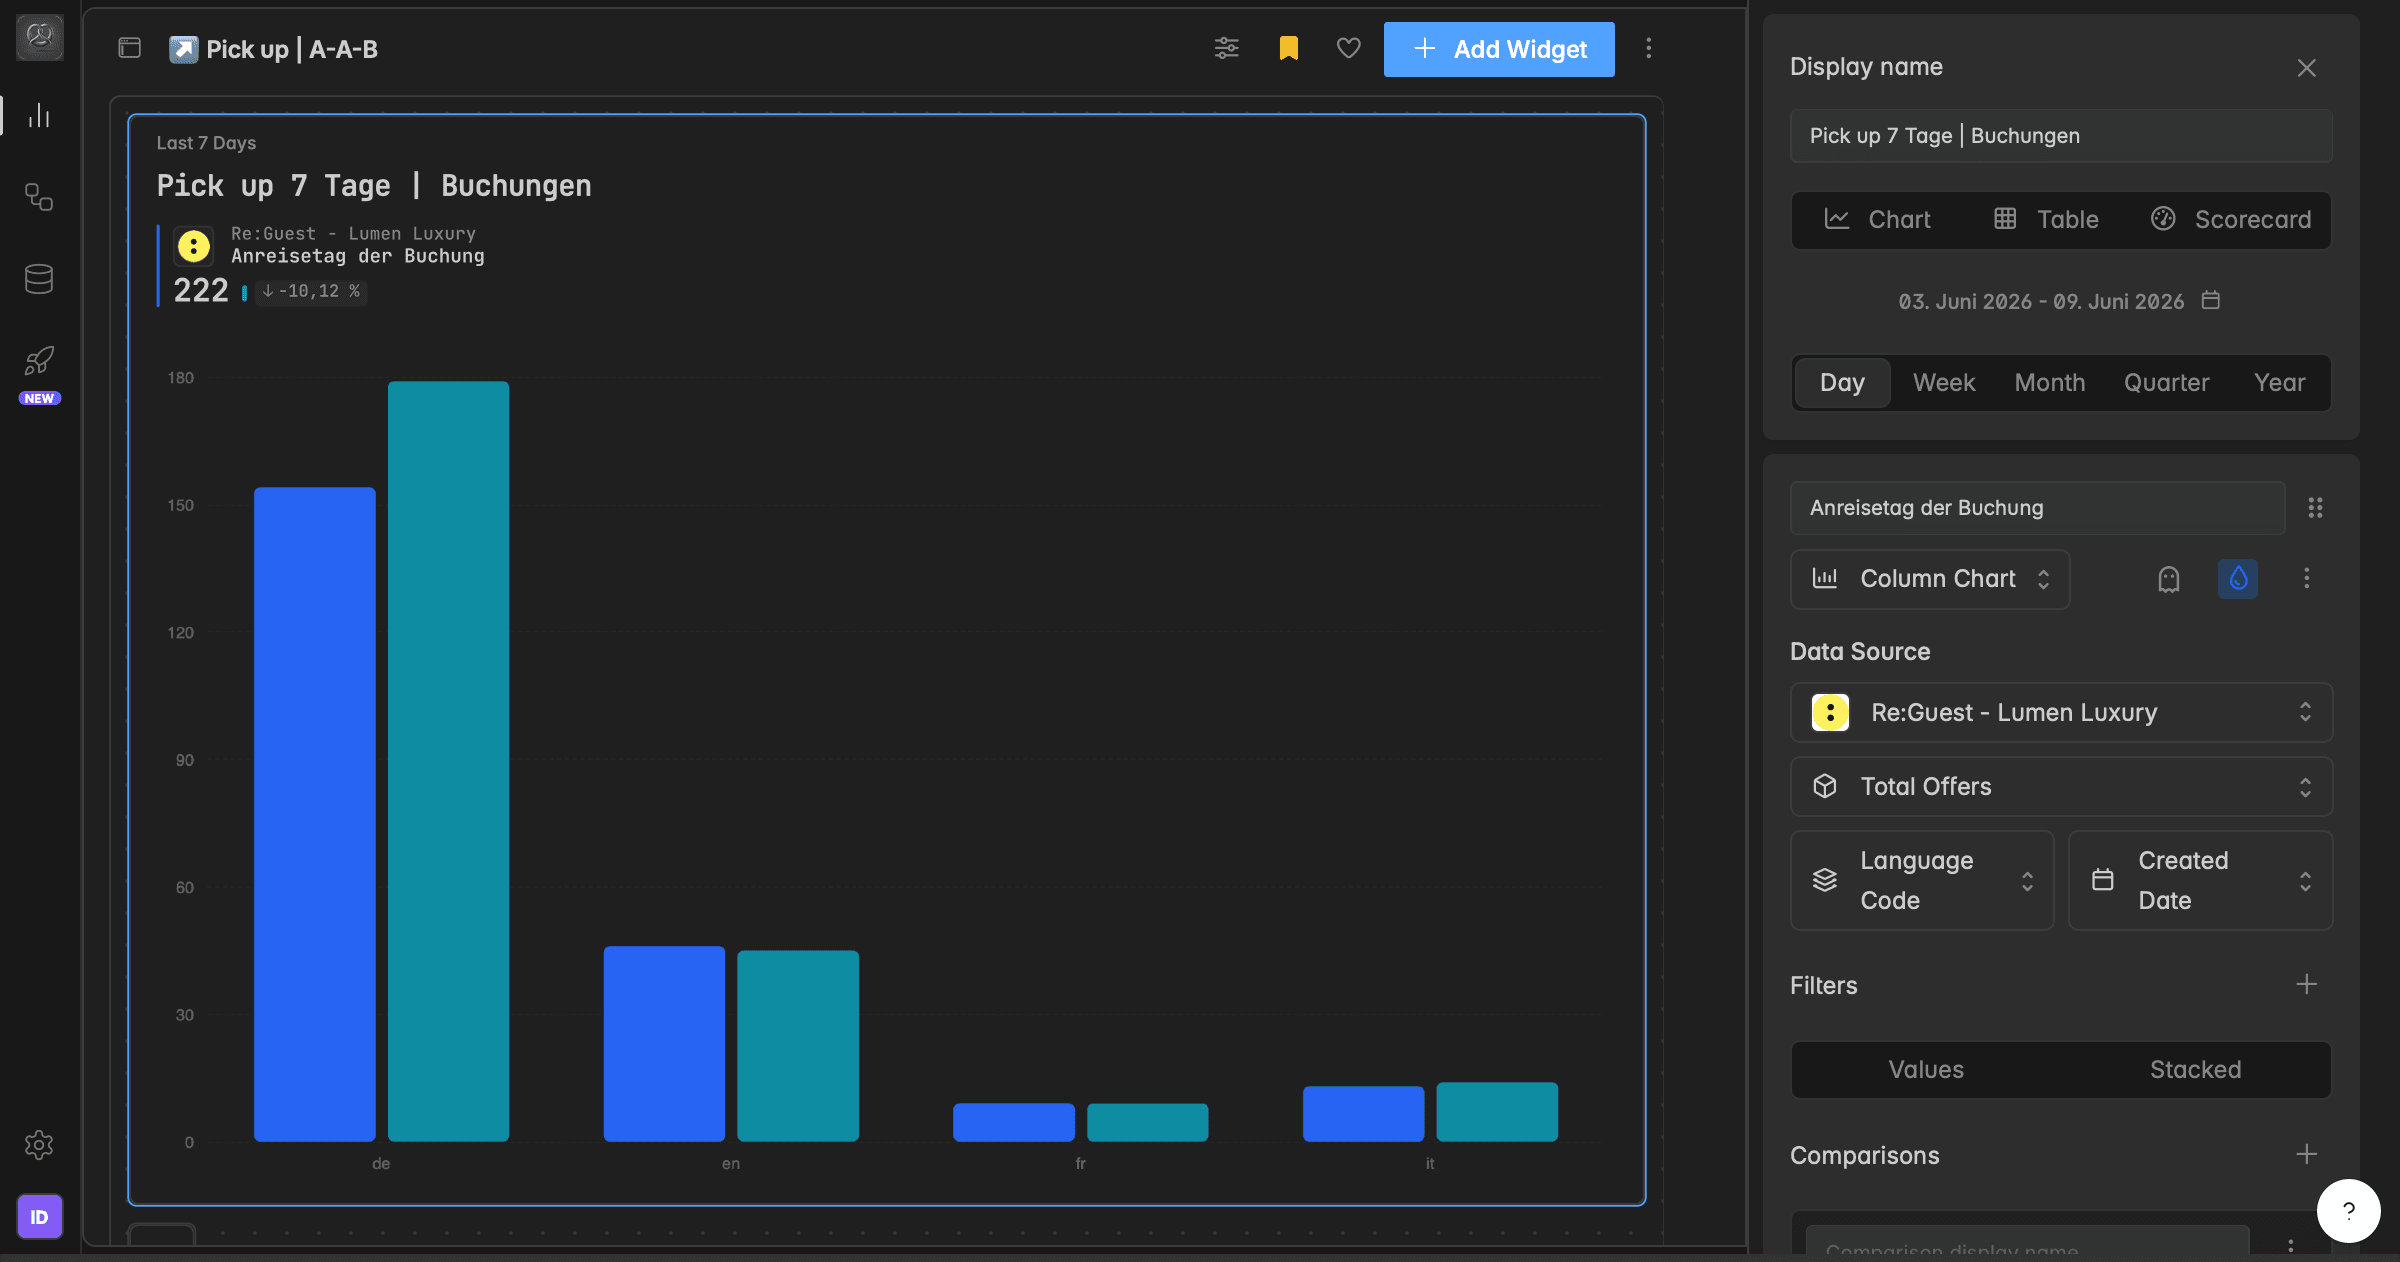
Grouping and perspective
In Indicate, both Grouping and Perspective are based on dimensions, but they serve two different purposes in how data is displayed and filtered.
Think of Grouping as the x-axis of your chart (what’s shown or compared) and Perspective as the filter logic (which date or category the data is taken from).
In short:
Grouping = How that slice is displayed (the structure)
Perspective = Which slice of the data you’re looking at (the lens)
Both are technically dimensions → but they control very different parts of your widget.
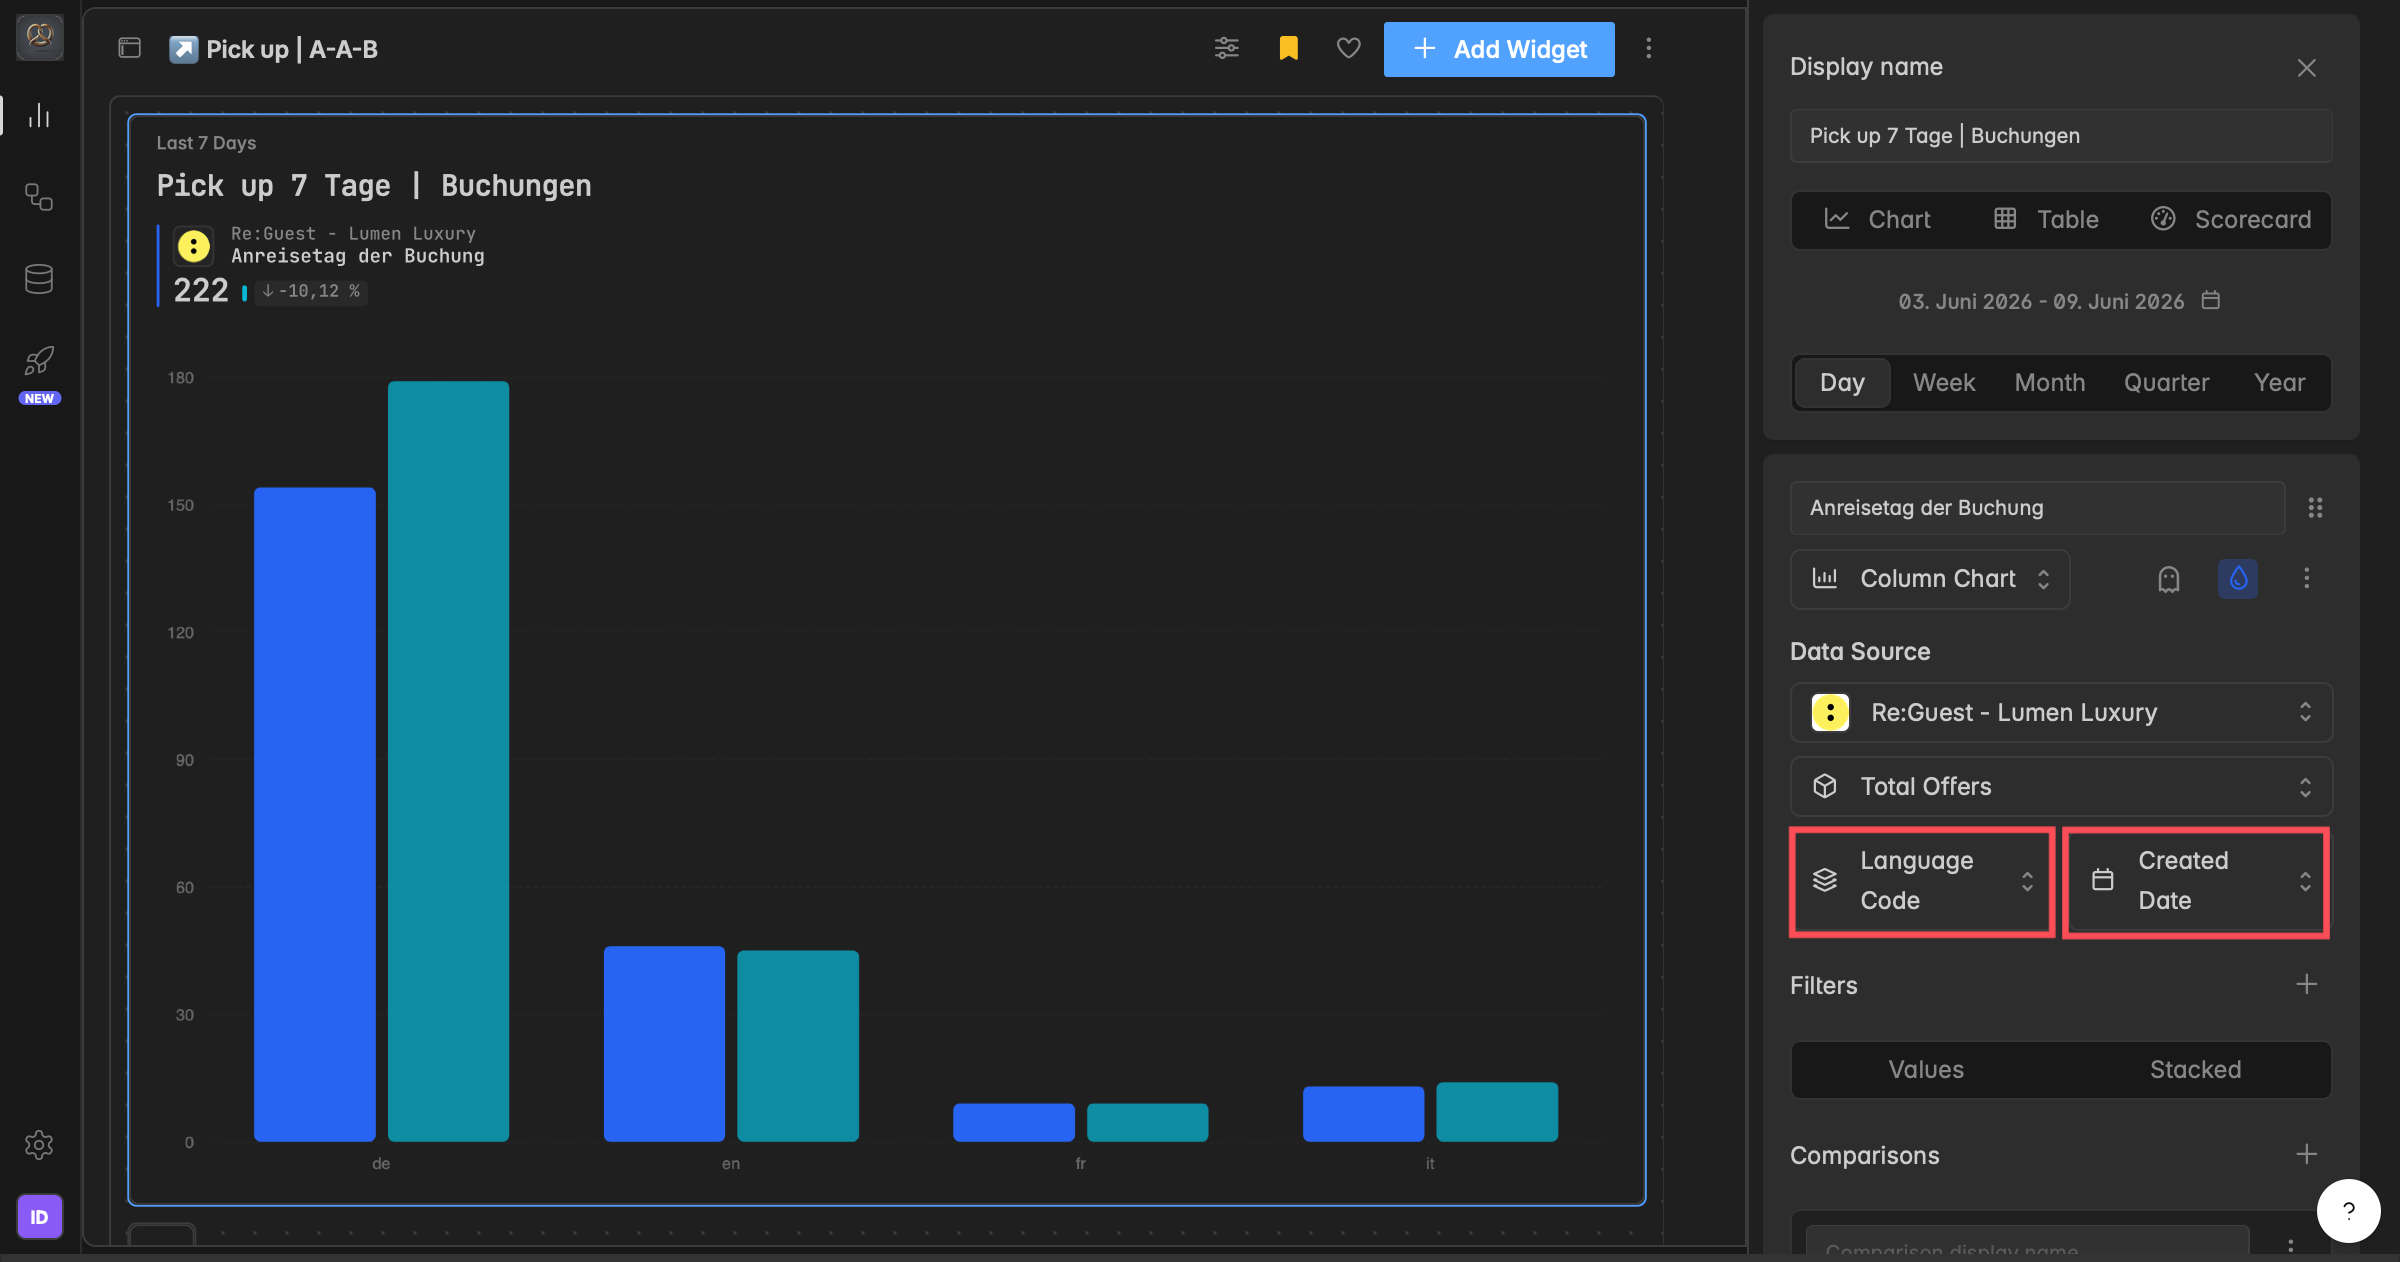
Both Grouping and Perspective are dimensions but Grouping controls how the data looks, while Perspective controls which subset of data is used.
What is grouping?
Grouping defines how your data points are arranged and compared in the widget.
It determines what appears on the x-axis, for example, whether you’re grouping by created date, channel, or country.
Examples:
Group by Created Date → see totals arranged by timeline.
Group by Channel → see totals per sales or marketing channel.
Group by Country→ see country names.
Grouping doesn’t change which data is included → it just changes how it’s shown.
What is perspective?
Perspective defines which dimension is used to filter your data → it’s the context of your selection.
For example:
If your date range is the last 7 days
and your Perspective is Arrival Date, Indicate filters data based on arrival dates in that range.
if your Perspective is Created Date, it filters based on when requests were created, not when arrivals happen.
So, Perspective = what defines which data is included in the visualization.
How grouping and perspective work together
Both settings combine to define how your chart behaves:
→ Take the metric Bookings
Example 1 | Example 2 | Example 3 |
|---|---|---|
You select:
This means your widget shows data grouped by country, so the country names (on x-axis) but only for data with a created date within the last 7 days. | You select:
The widget includes the bookings made in the last 7 days (perspective), and the x-axis shows when those guests arrive (grouping). It answers: of the bookings created in the last 7 days, when are they arriving? | You select:
Perspective: Arrival Date The widget includes the bookings arriving in the last 7 days (perspective), and the x-axis shows when they were booked (grouping). It answers: of the bookings arriving in the last 7 days, when were they booked? |
Was this helpful?