
Indicate changelog
Template Marketplace, New Meta Connector, New Dashboard Grid
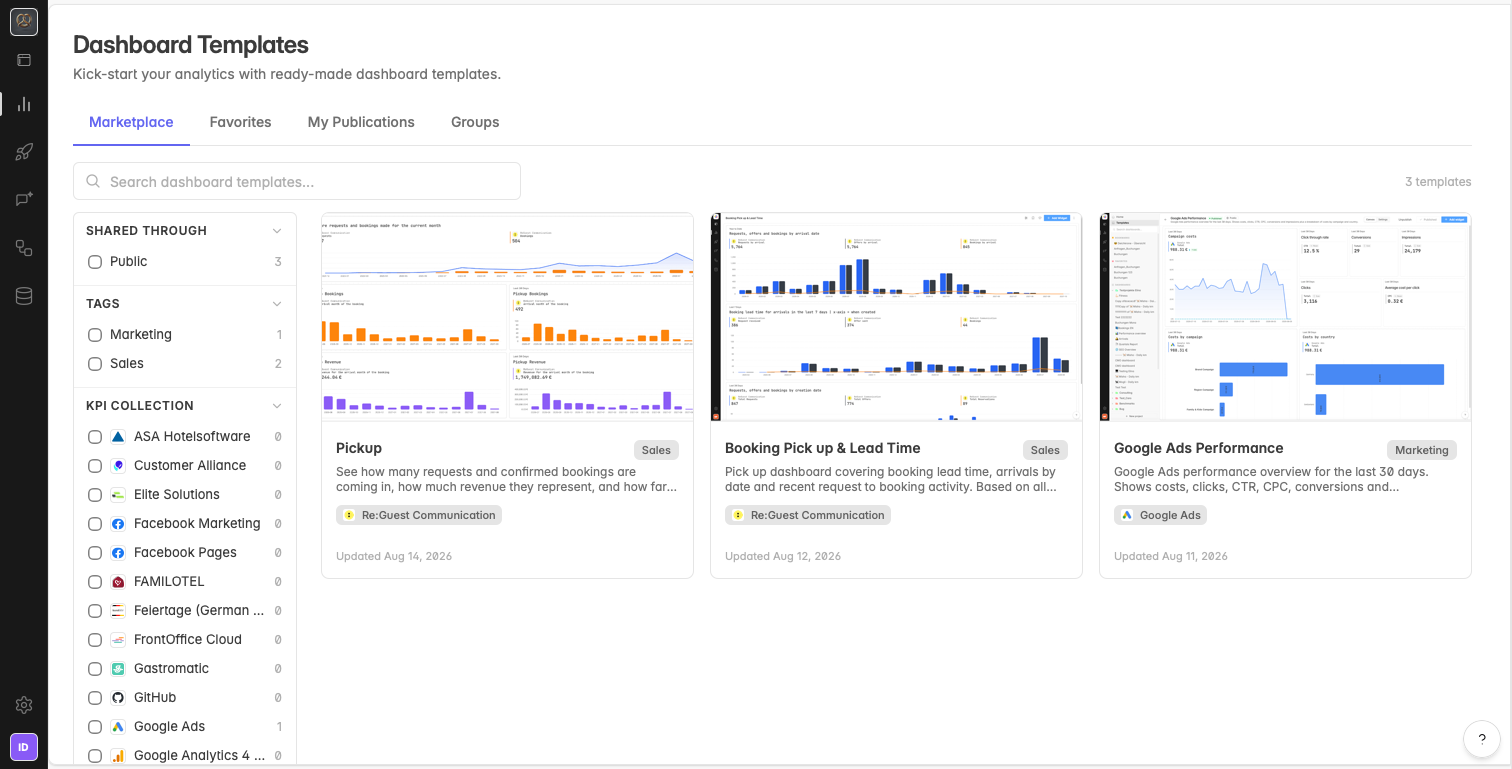
Template Marketplace: Ready Made Dashboards
Browse a library of prebuilt dashboards and apply one in a few clicks instead of building every dashboard from scratch. Pick a template that fits your use case and add it to your space.
The marketplace is also open for your own work:
Publish your own dashboards to the marketplace for others to use.
Or create internal groups, for example for an agency or for several properties, and share dashboards only within your own spaces instead of publicly.
You can find the Template Marketplace under Analytics → Templates.
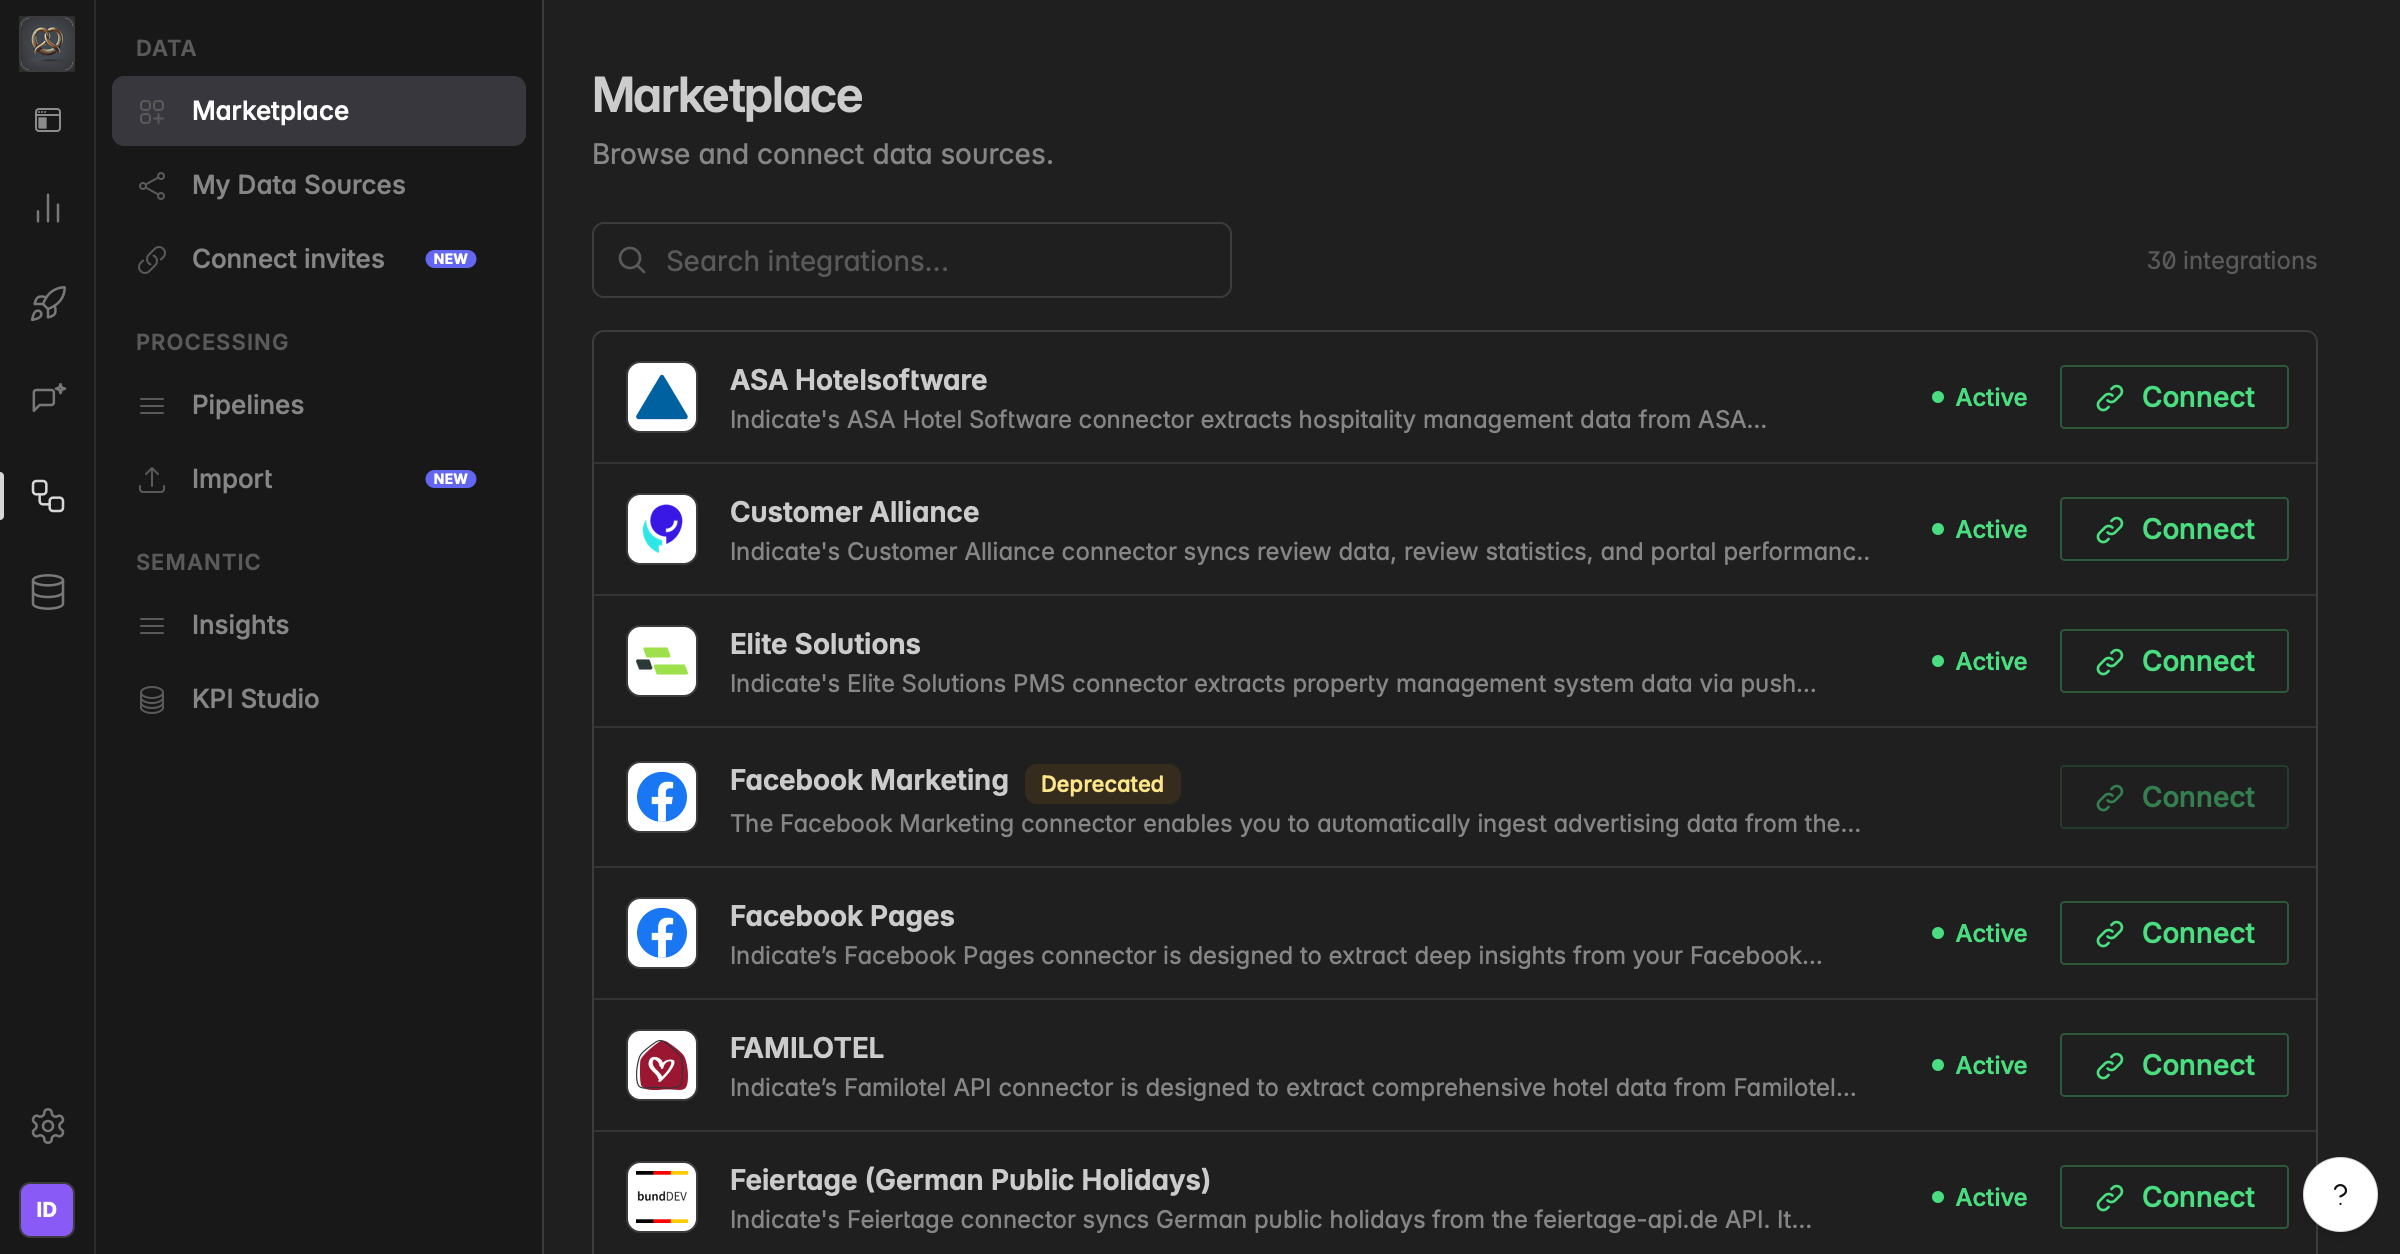
Meta Ads Connector: New Connection and New Metrics
The Meta connector has been rebuilt on a new data model and API with a wider set of metrics and dimensions. The previous Meta connector (Facebook Marketing) is now deprecated and will be switched off on November 1. You can no longer create a new connection with the old Facebook Marketing connector. Please connect the new Meta Ads connector instead.
We have already migrated all existing connections to the new Meta Ads connector for you, so your data keeps syncing without interruption. Please verify that everything works as it should for your new Meta Ads connections.
👉 If you have built dashboards with the Facebook Marketing connector, please switch your dashboard sources to the new Meta Ads connector before November 1. To do this, swap the data source on each dashboard to the new Meta Ads connector. Historic data stays available and readable.
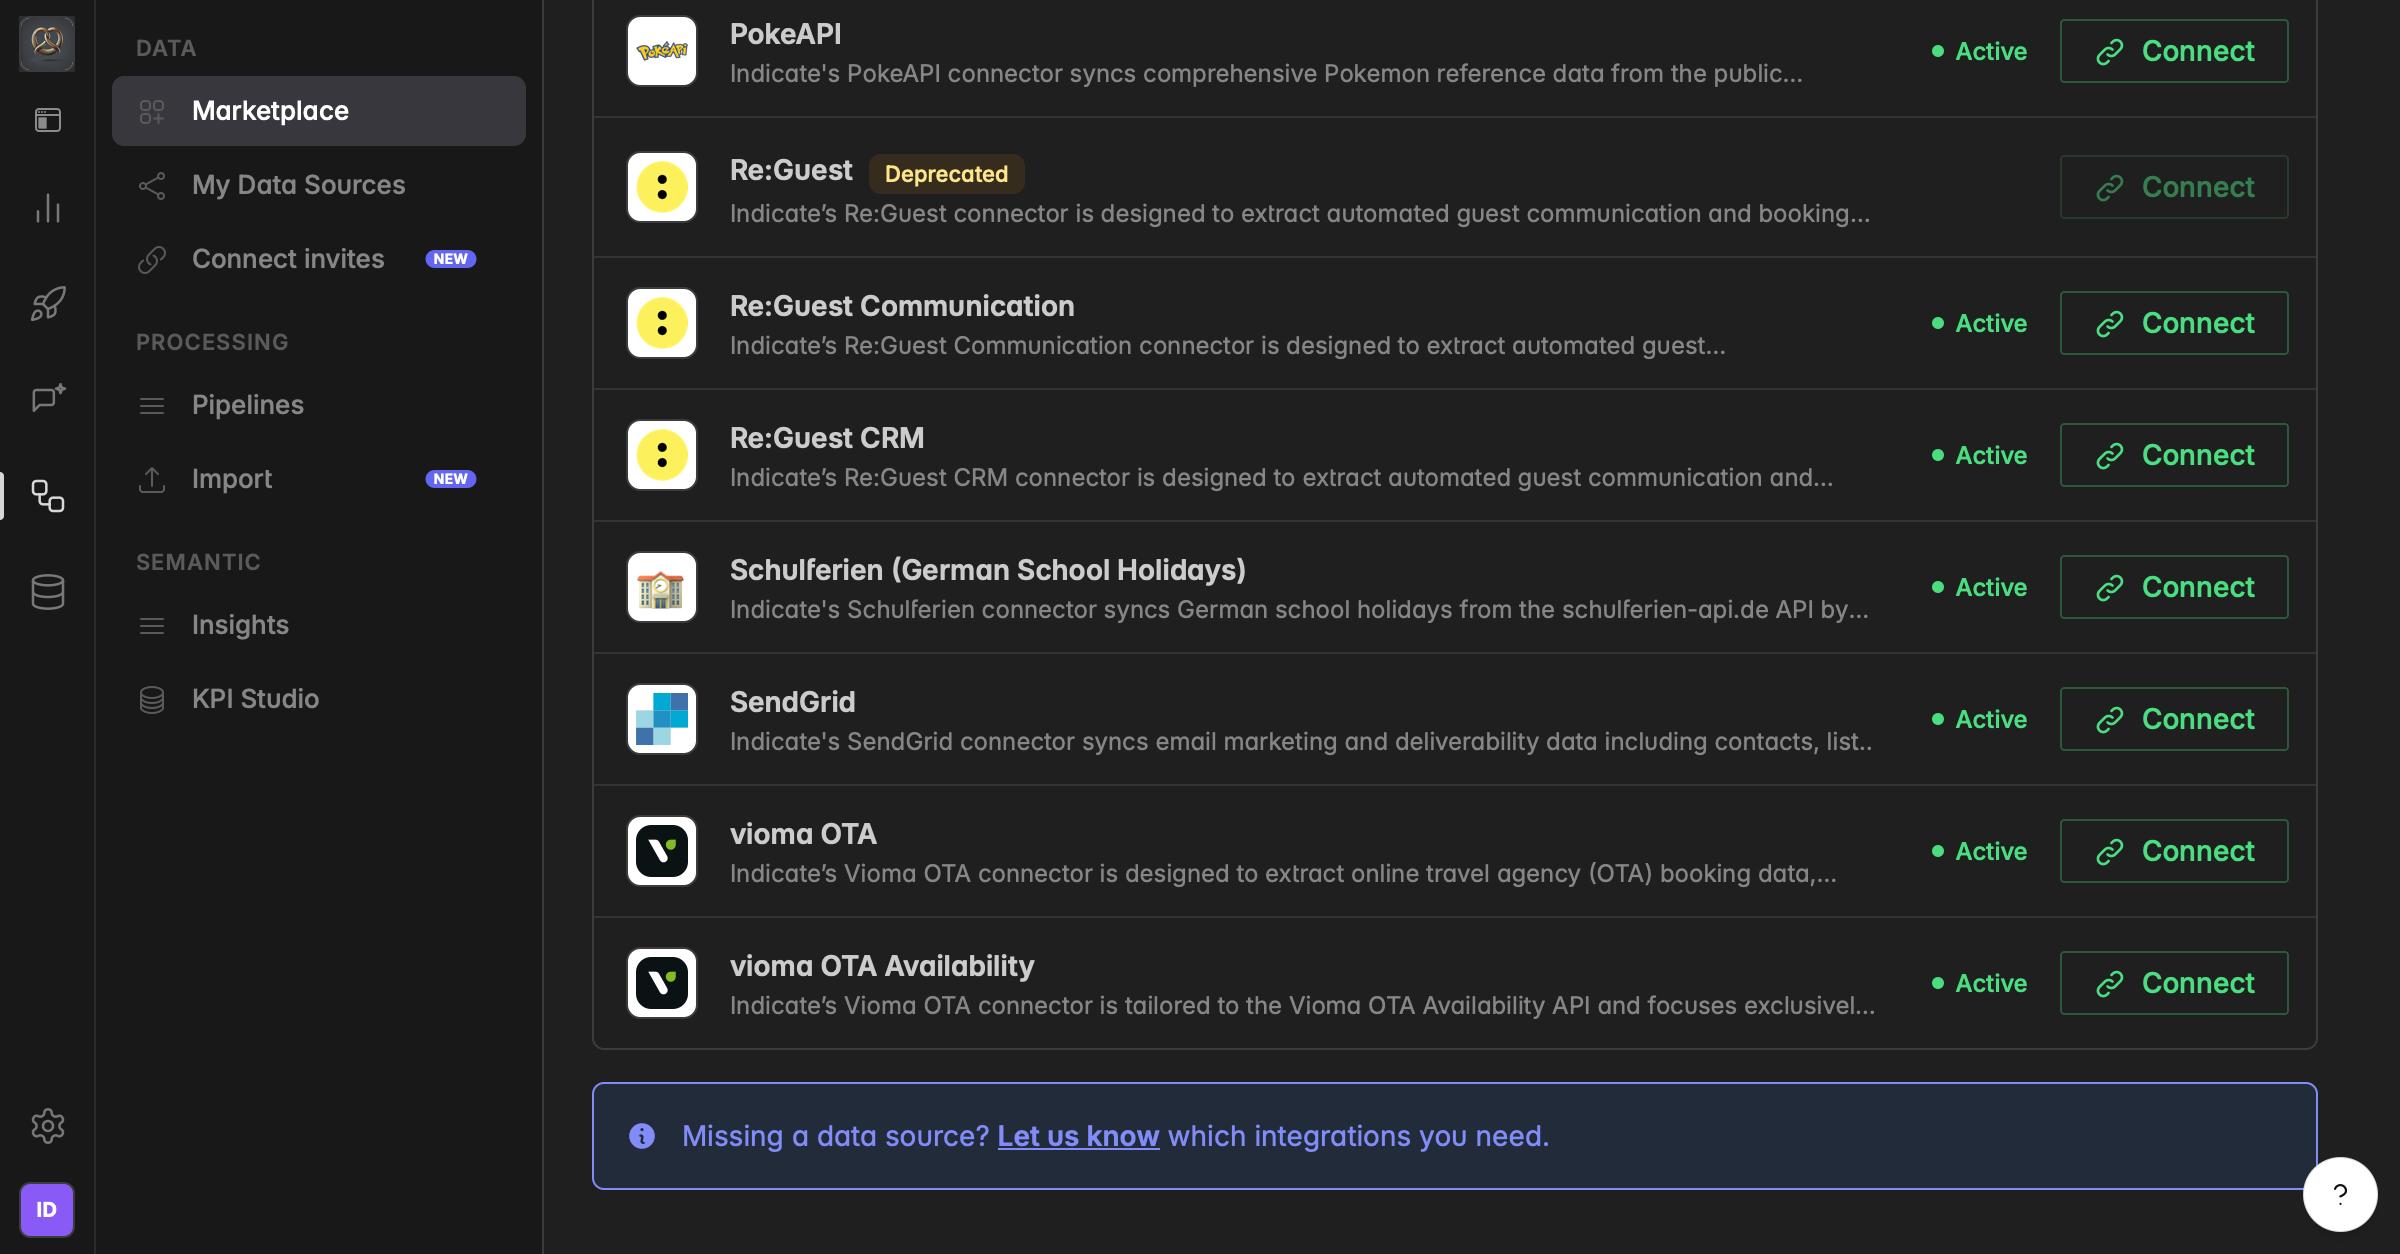
Re:Guest Communication Connector: More Metrics
The Re:Guest connector is now deprecated and will be switched off on November 1. Its replacement is the Re:Guest Communication connector. You can no longer create a new connection with the old Re:Guest connector. Please connect the Re:Guest Communication connector instead.
Please migrate all existing connections to the Re:Guest Communication connector, so your data keeps syncing without interruption.
👉 If you have built dashboards with the Re:Guest connector, please switch your dashboard sources to the Re:Guest Communication connector before November 1.
The Re:Guest Communication connector includes everything from the previous Re:Guest connector, plus 15 additional KPIs.
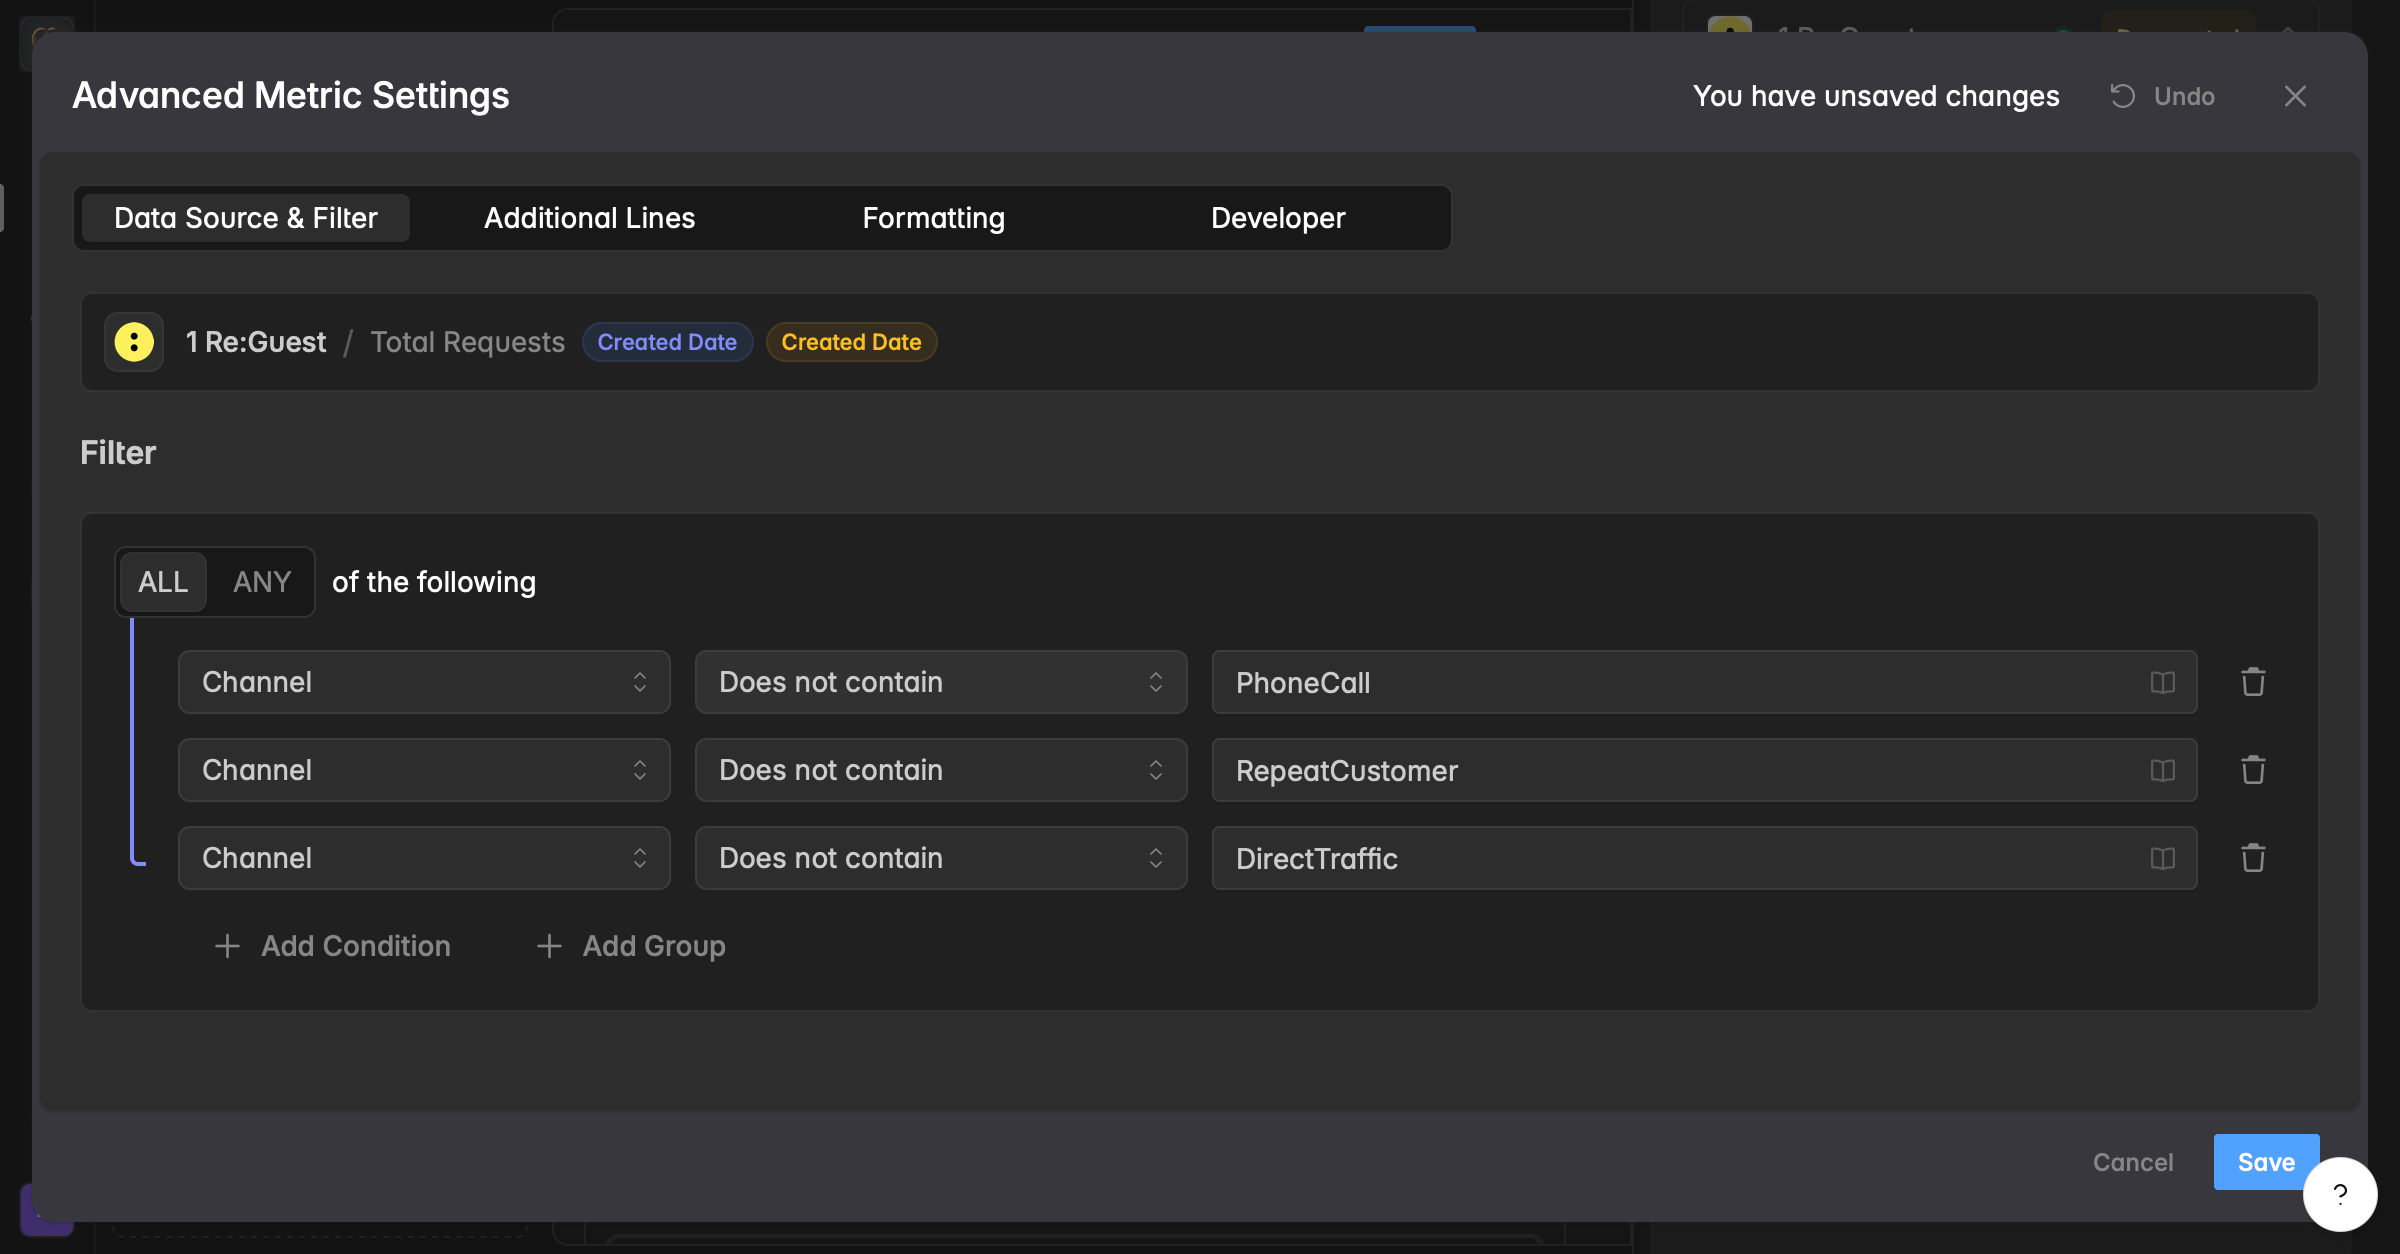
New: Does Not Contain Filter
Filters now support a "Does not contain" option. Use it to exclude records whose text field holds a given value, for example, hide every campaign with "Test" in its name.
You can find it on your dashboards by clicking on a widget, then navigating to the right sidebar (widget designer) under Advanced Options → Data Source & Filter tab. Click on the little booklet icon 📖 to see all filter options in a dropdown, or type whatever value should not be included.
Learn more about filters here.
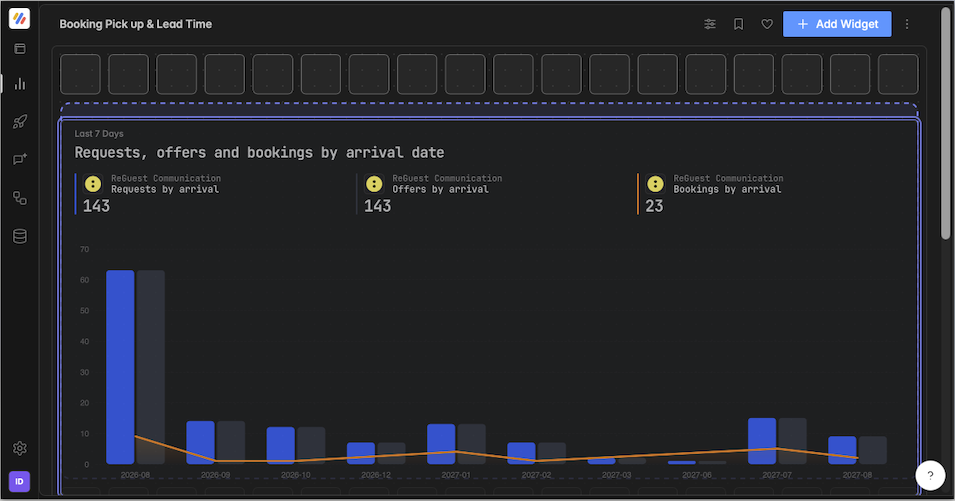
New Dashboard Grid: Smoother Layout
Dashboards now run on a new grid for placing, moving, and resizing widgets.
Improvements
Combo box search inputs accept spaces, making searches easier
Activation flow adds a privacy consent checkbox.
CSV imports support files up to 200MB.
Claude & ChatGPT Connection, Custom Agents
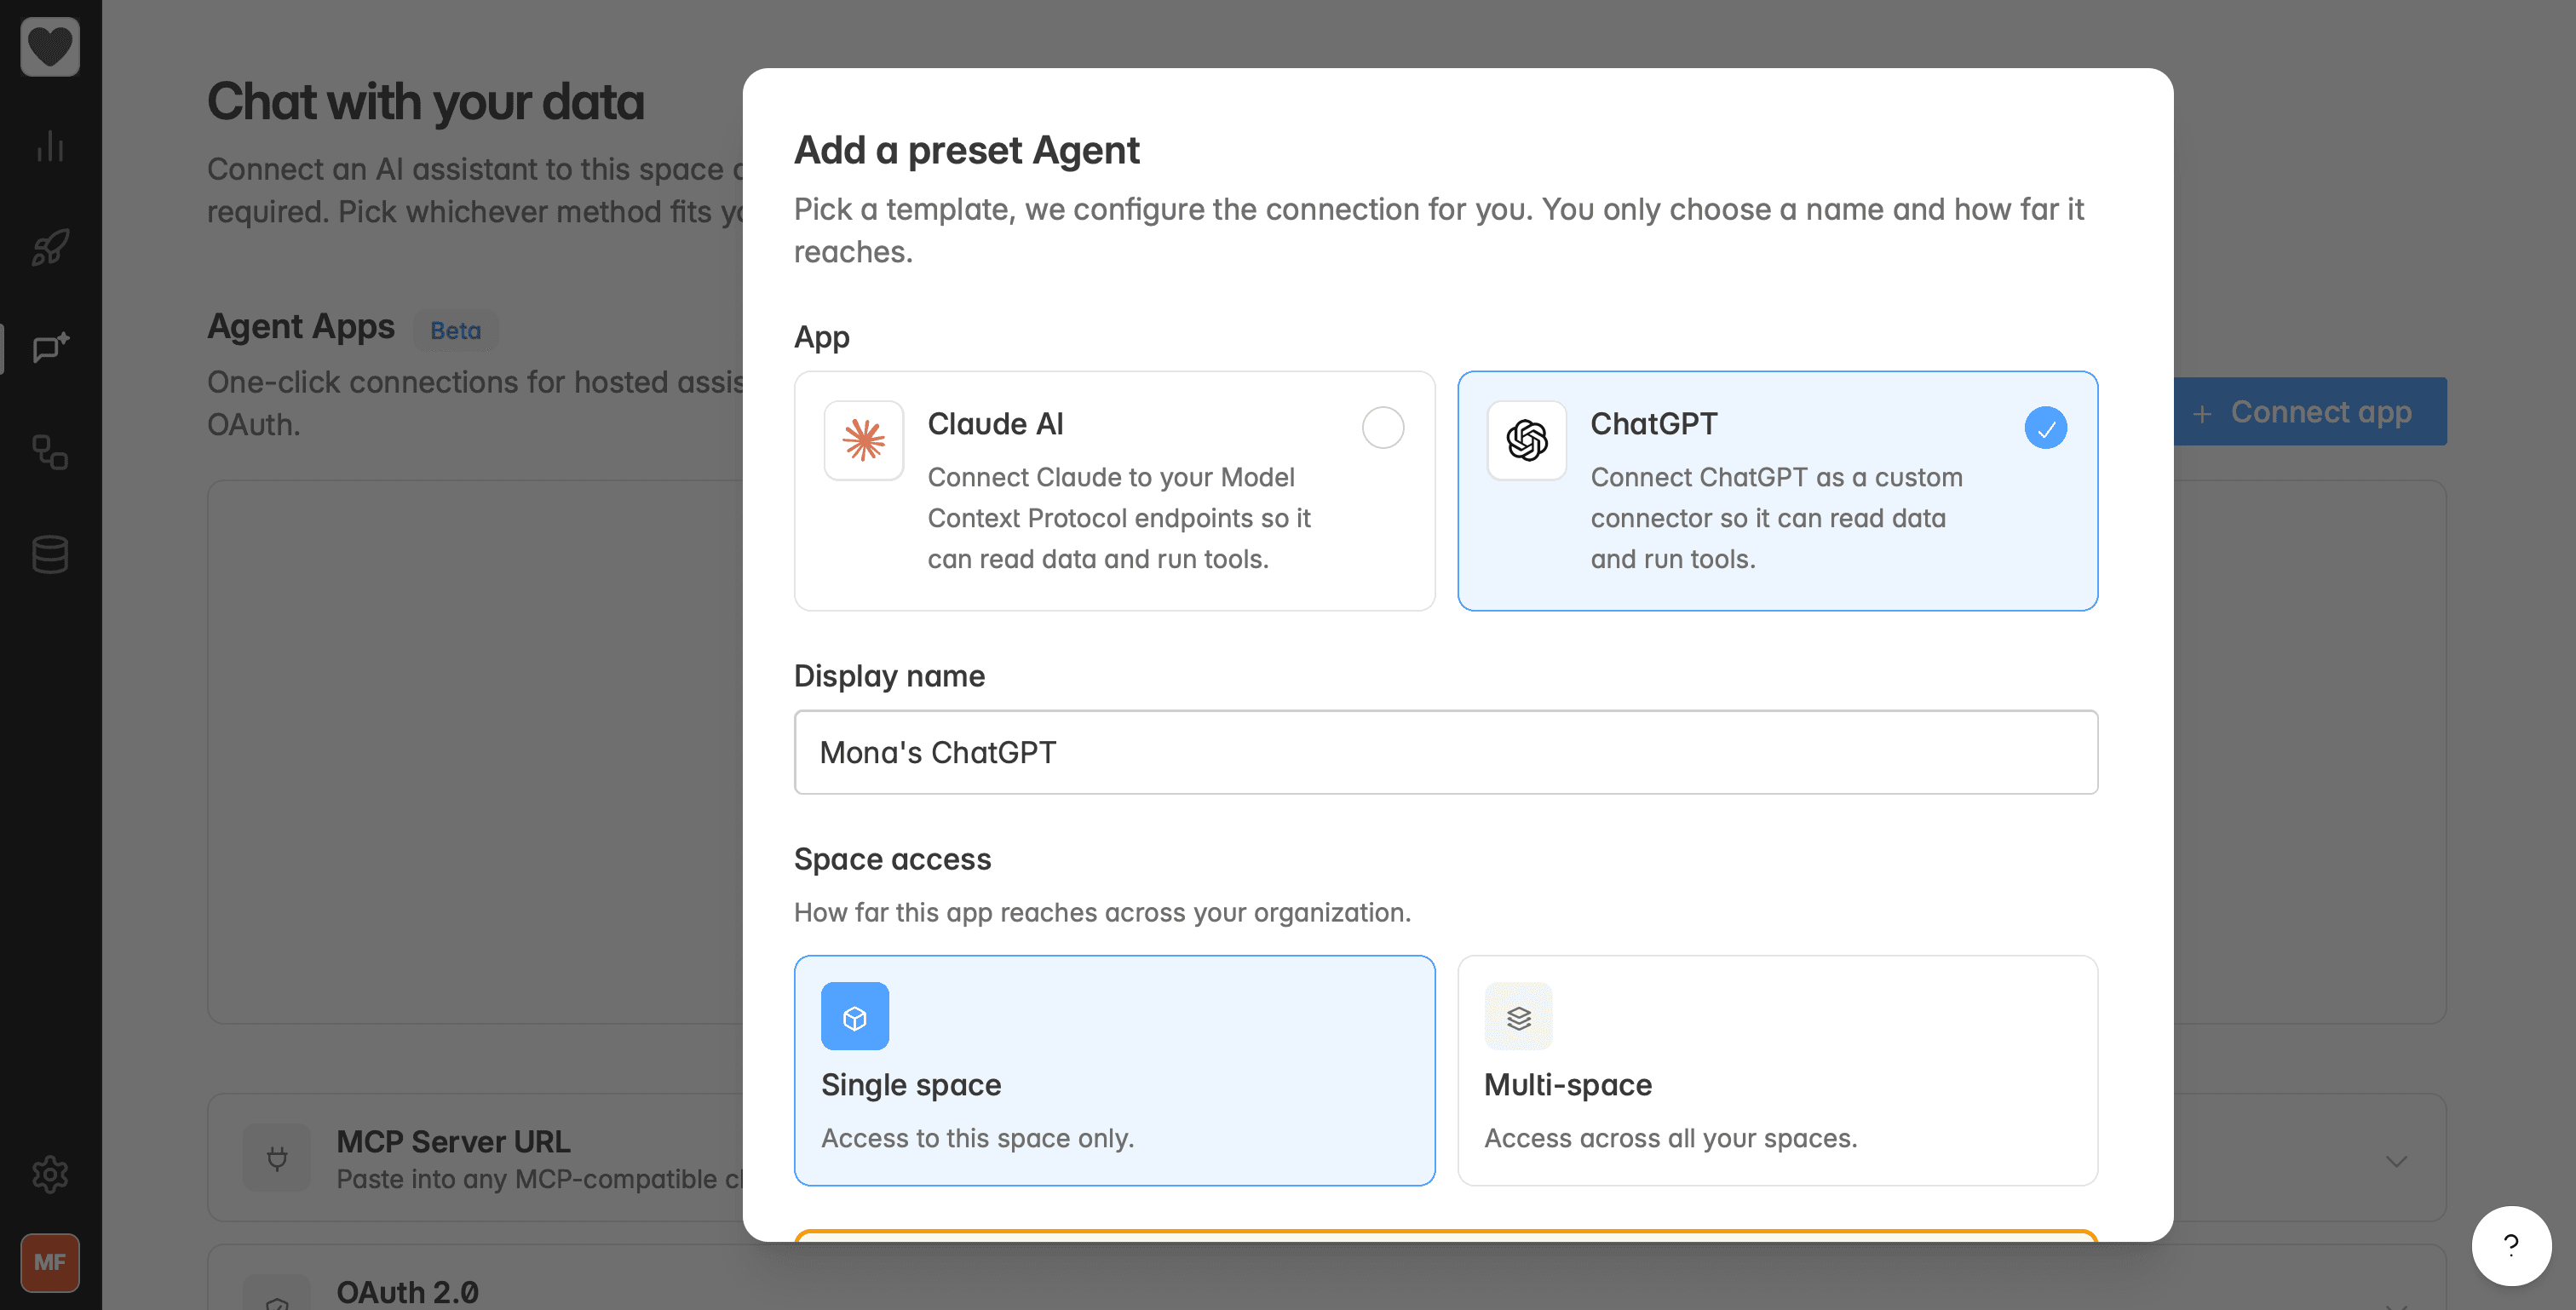
Bring Indicate Into Claude and ChatGPT
Connecting Indicate to Claude and other chatbots has been possible since last year. Now there are three big updates:
connecting your chatbot is easier than before
ChatGPT works too
and you can reach Indicate via your chatbot from your phone.
You set up the connection once and then ask about your data right inside the AI chatbot you already use.
You can find Apps inside your Indicate space under "Chat with your data" in the left navigation bar.
Ask Your Data Anything, From Any Device
Once connected, the AI does the heavy lifting:
It moves through your data in seconds and answers all the questions you have.
It spots anomalies on its own, so you catch problems early.
It pulls from your different data sources and gives you clear action recommendations.
It scales across your properties, so you can ask about one or all of them at once.
Mobile: Reach Your Data On the Go
Open Claude or ChatGPT on your phone and Indicate is already connected there. Ask a question right in the app and get your numbers and recommendations on the go.
Easier to Connect
Connecting Indicate to your chatbot is now much simpler than before.
Here is how it works:
Go to "Chat with your data" and click the + Connect App button.
Pick Claude or ChatGPT and give the connection a name.
Decide whether the app connects to all the Indicate spaces you are a member of, or just the one where you create the app connection.
Click Create App. Only admins can do this, as you need to subscribe to an add on.
Indicate creates a Client ID and Client secret for you.
Open Claude or ChatGPT and use those credentials to add Indicate there.
Done. Now you can ask about your Indicate data right inside the chat.
Home Screen, Connect Links, Redesigned Sidebar, Chat with Your Data, Onboarding
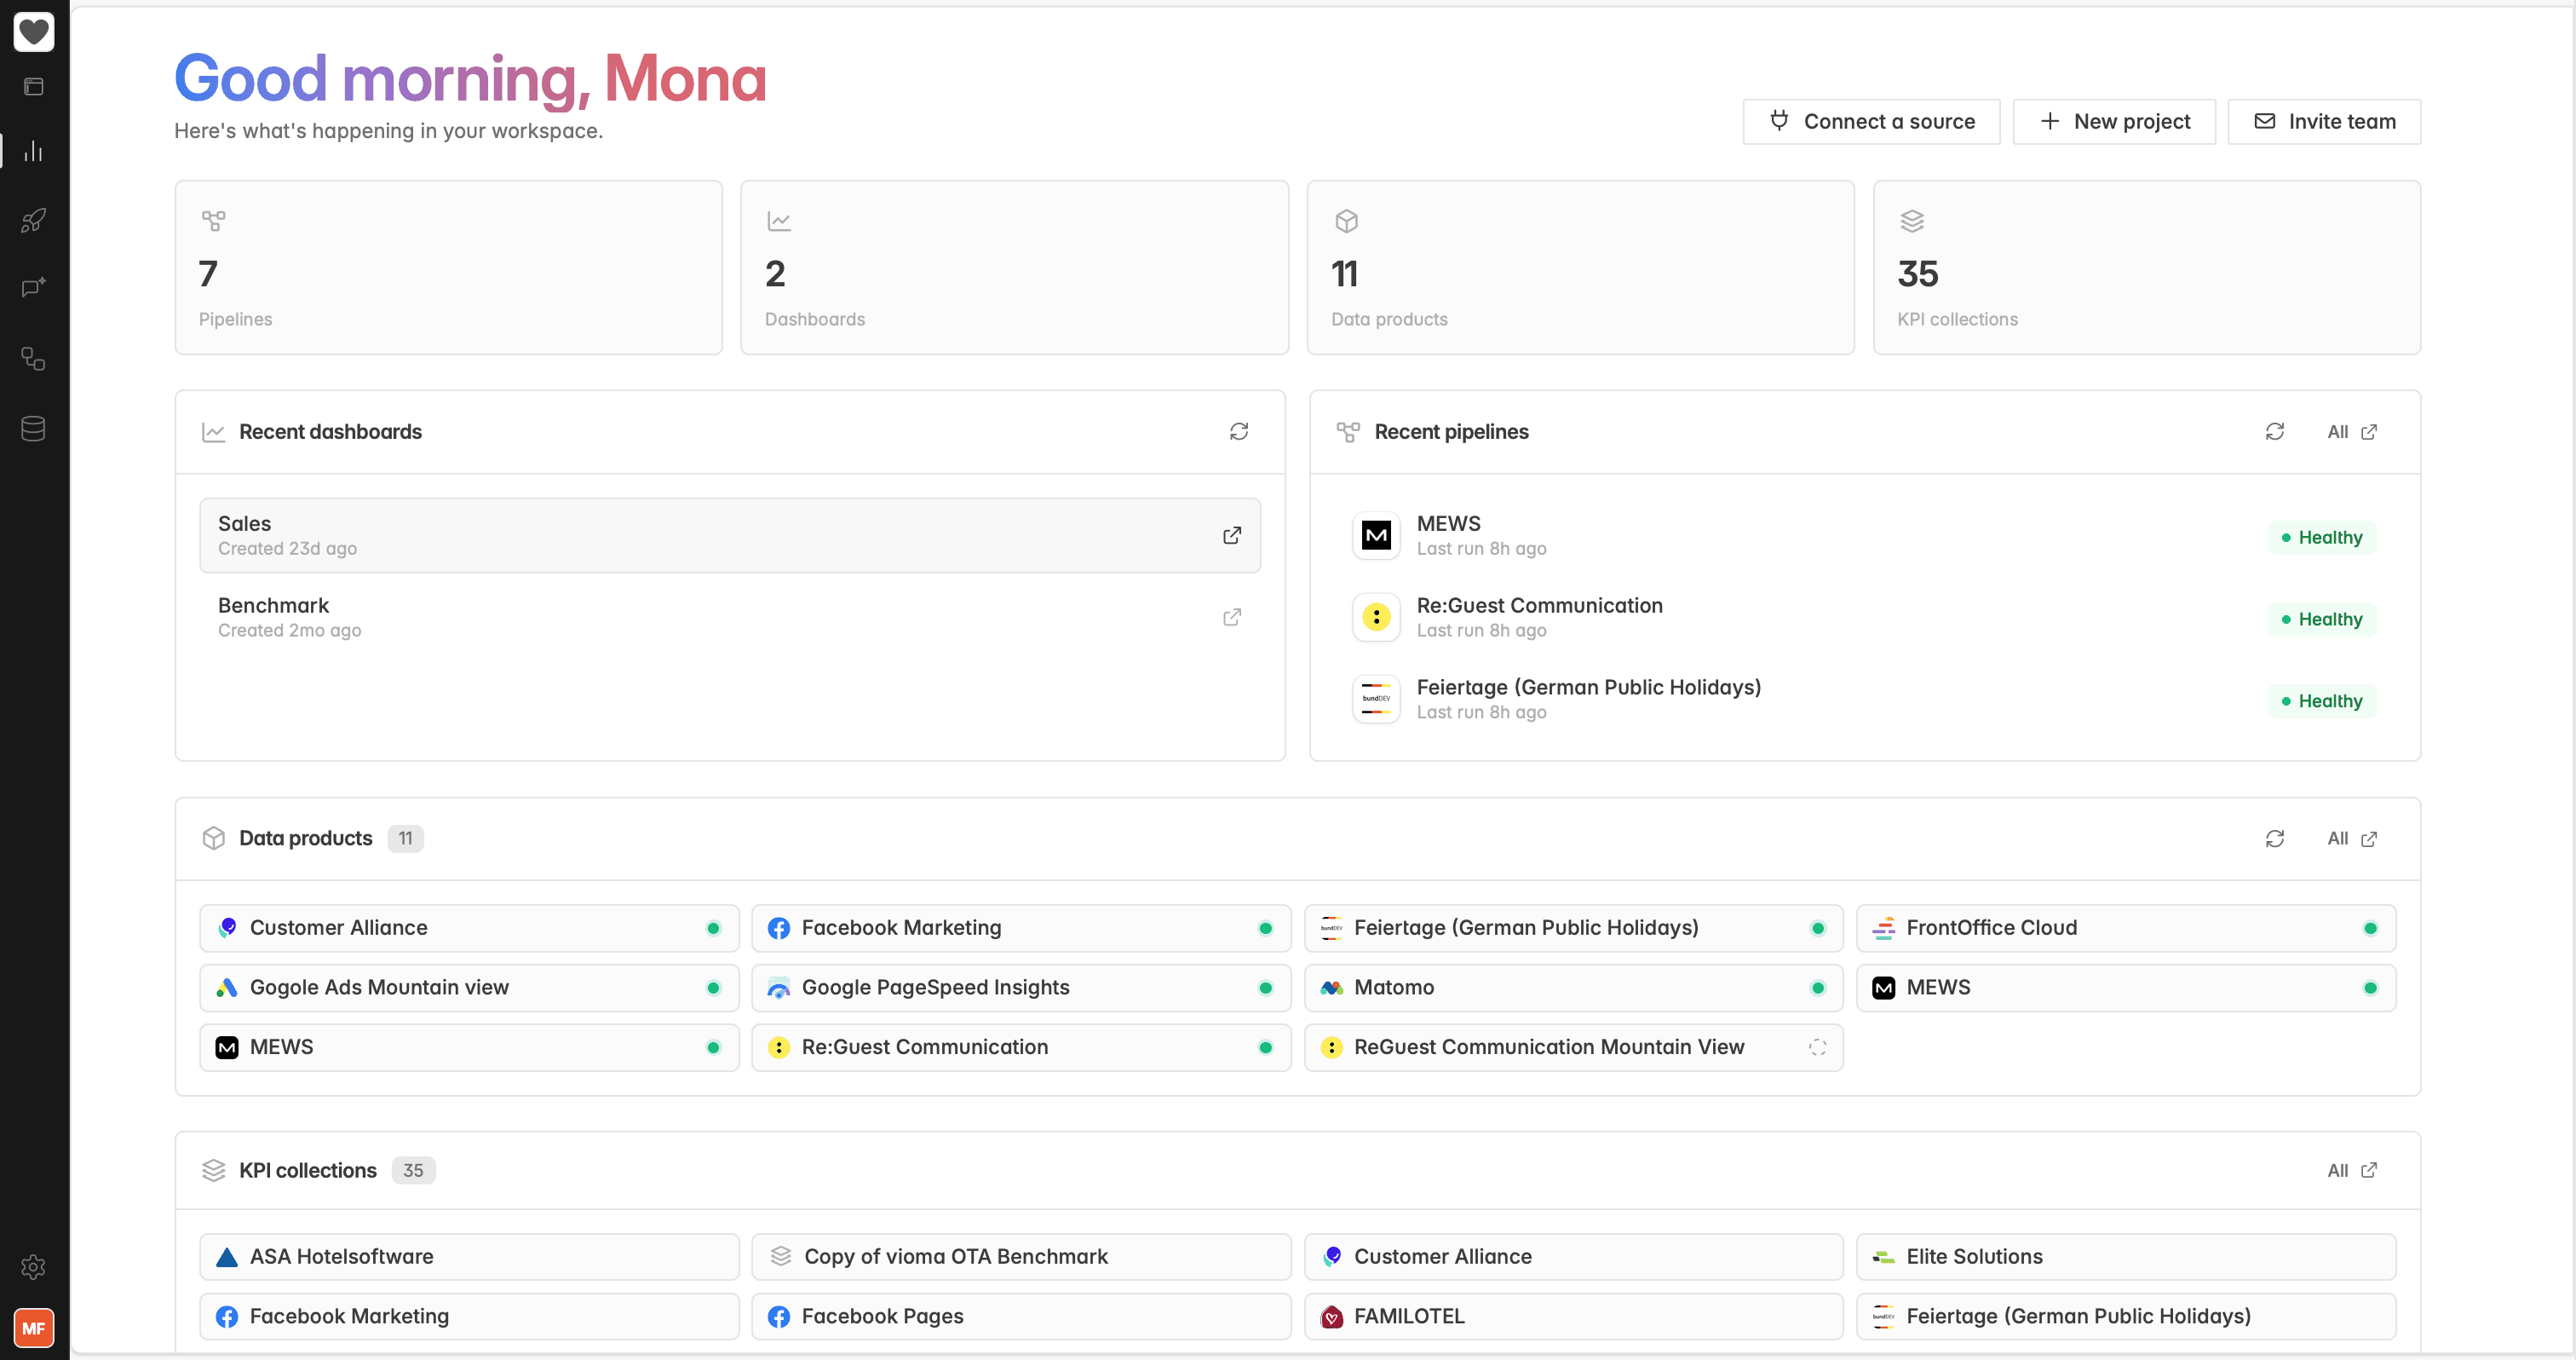
New Home Screen
Your Analytics Home screen has been completely redesigned. You now see everything that matters the moment you log in, from a live overview of your data to the items that need you right now.
Four overview cards at the top show your current Pipelines, Dashboards, Data products, and KPI collections.
A "Needs attention" section surfaces failing pipelines right away, so you can act fast.
Recent dashboards and recent pipelines give you one click access to what you worked on last.
Your data products and KPI collections are listed directly on Home.
Your onboarding tutorial lives here too, so you can pick up your setup at any time.
You can find the new layout on your Home screen in the Analytics section.
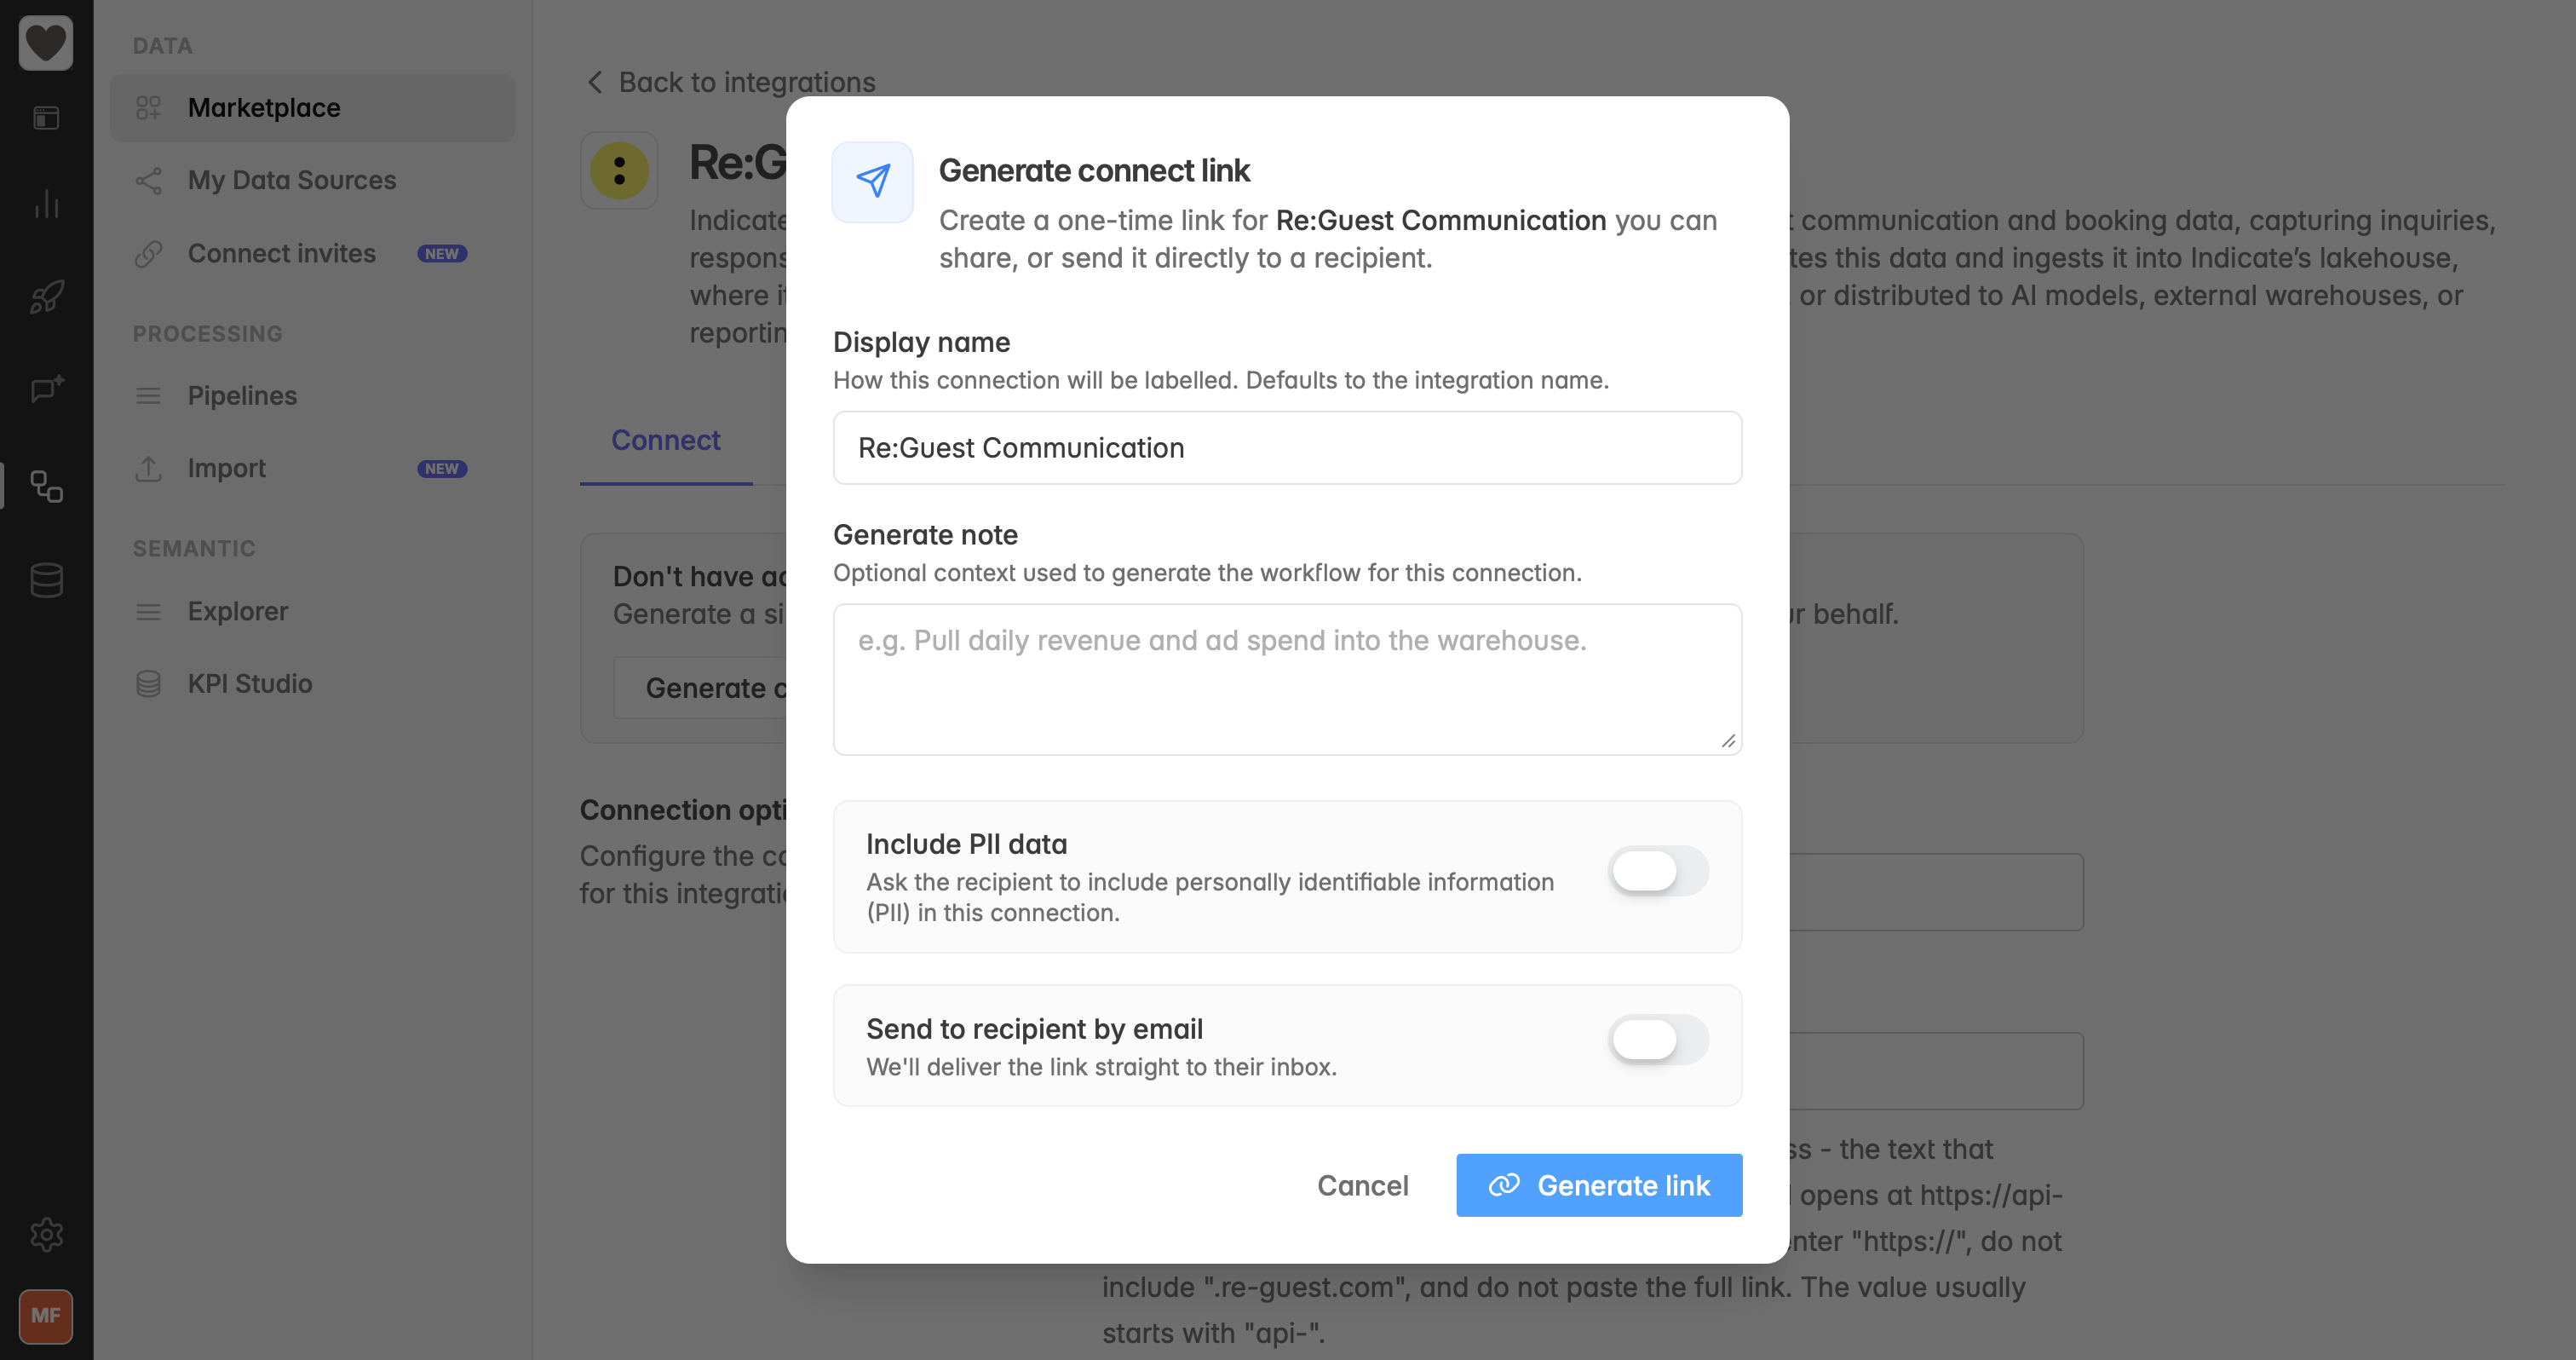
Connect Links: Let Someone Else Connect a Data Source for You
You no longer need the credentials yourself to connect a data source. Generate a single use connect link and send it to the person who has access, for example a client, a colleague, an external agency, or the vendor themselves. They connect the integration for you in a privacy compliant way, without ever sharing their login with you.
Generate a one time link for any data source, then copy it or have it sent straight to a recipient by email.
Add an optional note if you want to add context or extra information.
Every invitation comes with a friendly intro text automatically, and you can decide whether PII data is enabled or not (depending on the data source).
The "Connect invites" view lists every data source you have shared by link, so you can keep track of what is still pending, resend or revoke an invitation.
You can find "Generate connect link" in the Marketplace under Engineering → Marketplace. Select the data source you would like to connect to get started. Or add a new data source from many places in the app, including the integration page, the dashboard when you add a new widget, and the Widget Builder.
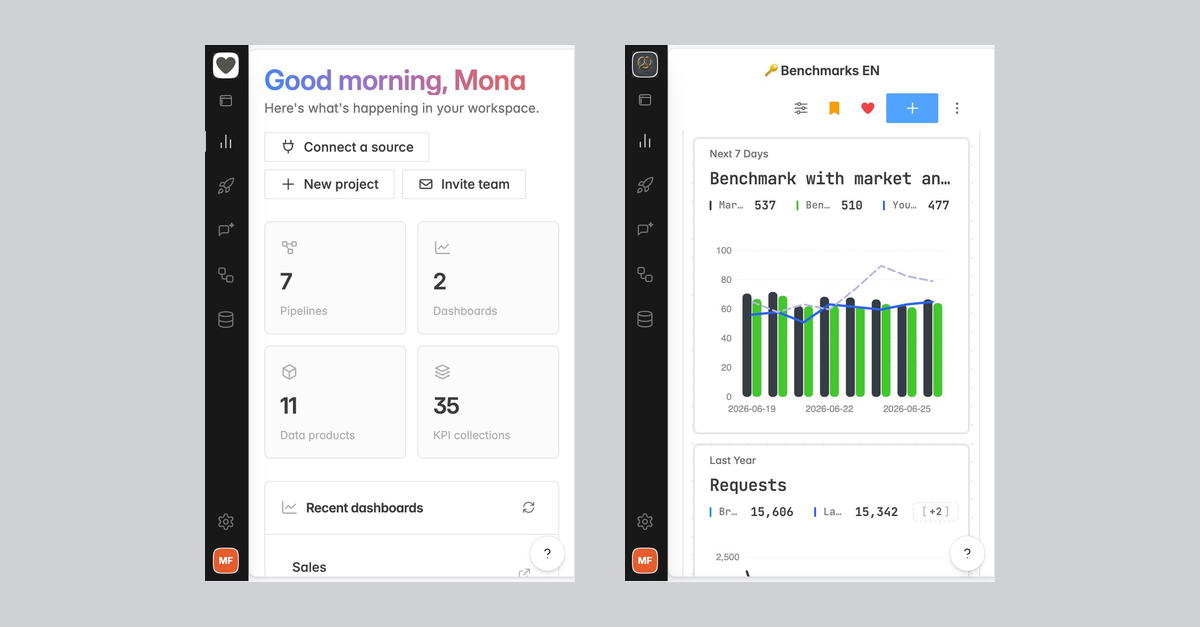
Mobile: More of Indicate Data on the Go
Indicate is now available on mobile. You can review and manage your entire workspace from your phone, not just from your desktop. Almost every action you know from desktop now works while you are away from your computer.
Search your databases directly on mobile.
Review your dashboards and KPIs wherever you are.
Manage and adjust your workspace on the go.
You can access everything by logging into Indicate on your phone with your normal login, the same app you already use.
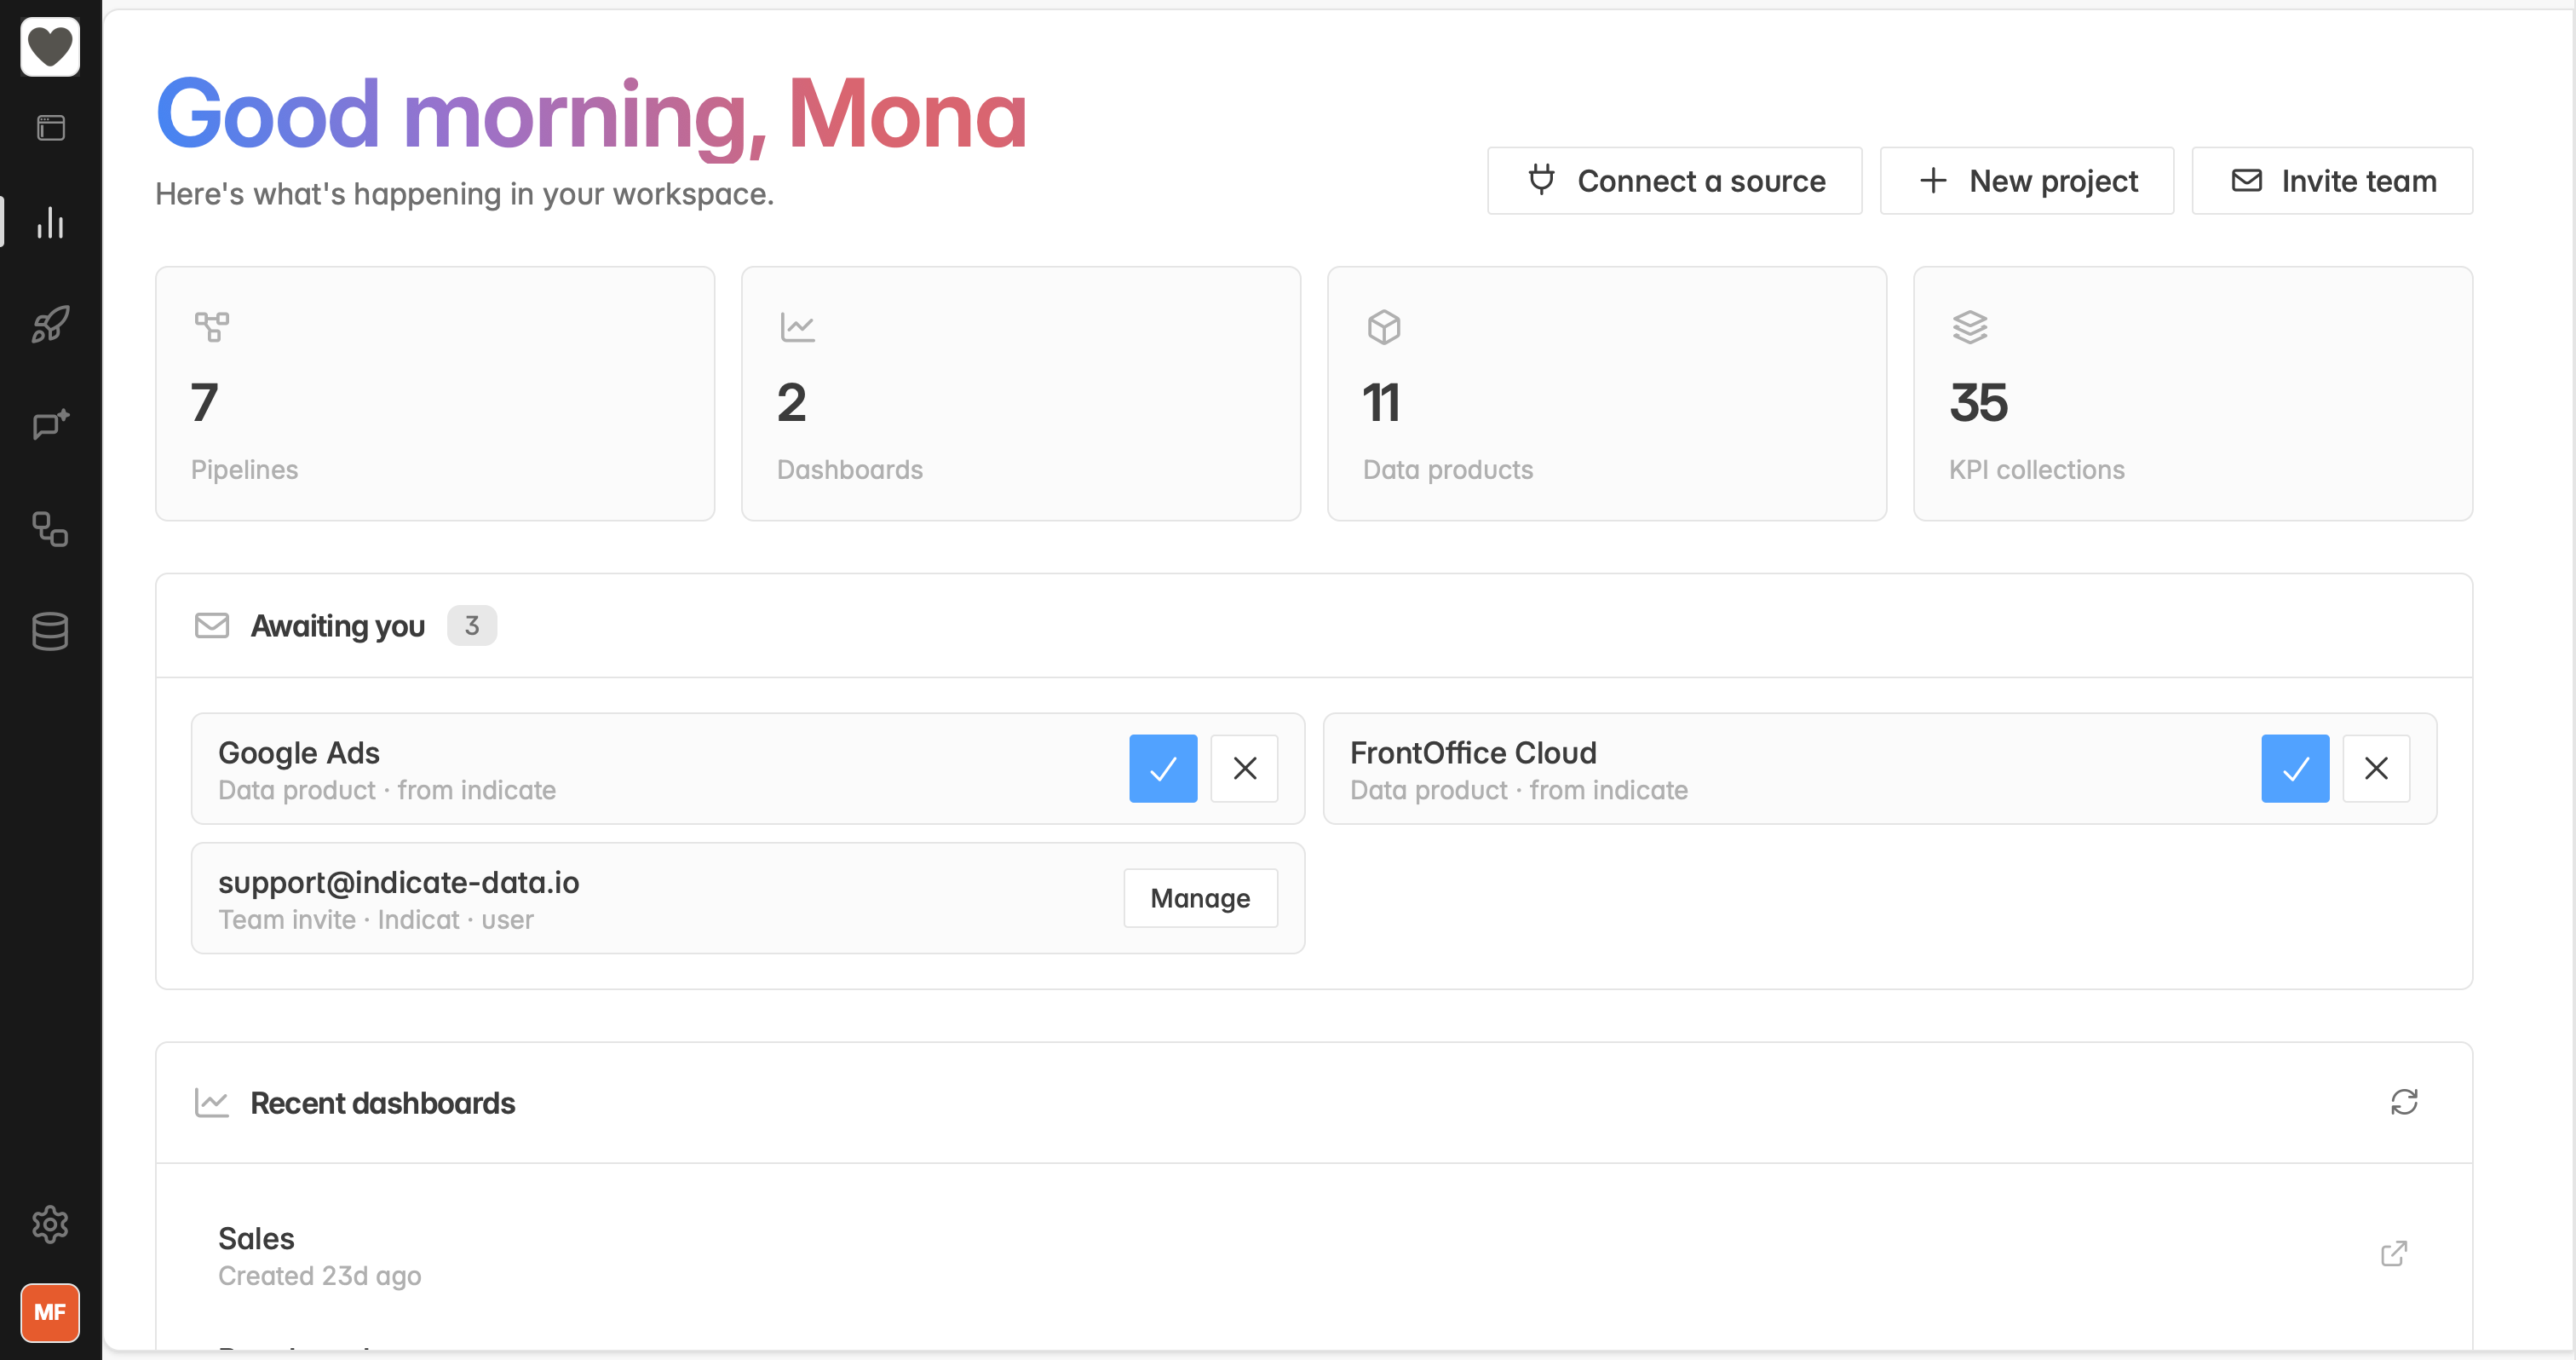
Shared Data Products: Invitations Now Visible
When someone shares a data product with you or a new team member is invited, you now see it directly on Home in the new "Awaiting you" section. Accept or decline a shared data product in one click, or open "Manage" for team invites.
You can find pending invitations under "Awaiting you" on your Home screen.
Redesigned Sidebar: Grouped and Collapsible Navigation
The left navigation has been reorganized and is now collapsible. Collapse it for more screen space or expand it when you want the labels, and it adapts to smaller screens.
Your core tools are grouped together: Analytics, Flying KPIs, and Chat with your data.
Engineering and Data Studio now live at the bottom of the sidebar.
Collapse or expand the sidebar at any time, and it stays responsive on smaller screens.
Chat with Your Data: Guided Assistant Setup
Connecting an AI assistant to your workspace is now guided step by step. Create an agent token, pick your client, and follow the setup to ask questions about your data in plain language, no SQL required.
Choose your client: VS Code, Claude Desktop, or Claude Code.
Select your operating system, macOS or Windows, and get the matching setup steps.
Copy a ready to paste configuration for the Indicate MCP server.
Manage your agent tokens, with status, scope, and activity, all in one place.
You can find Chat with your data in the left navigation.
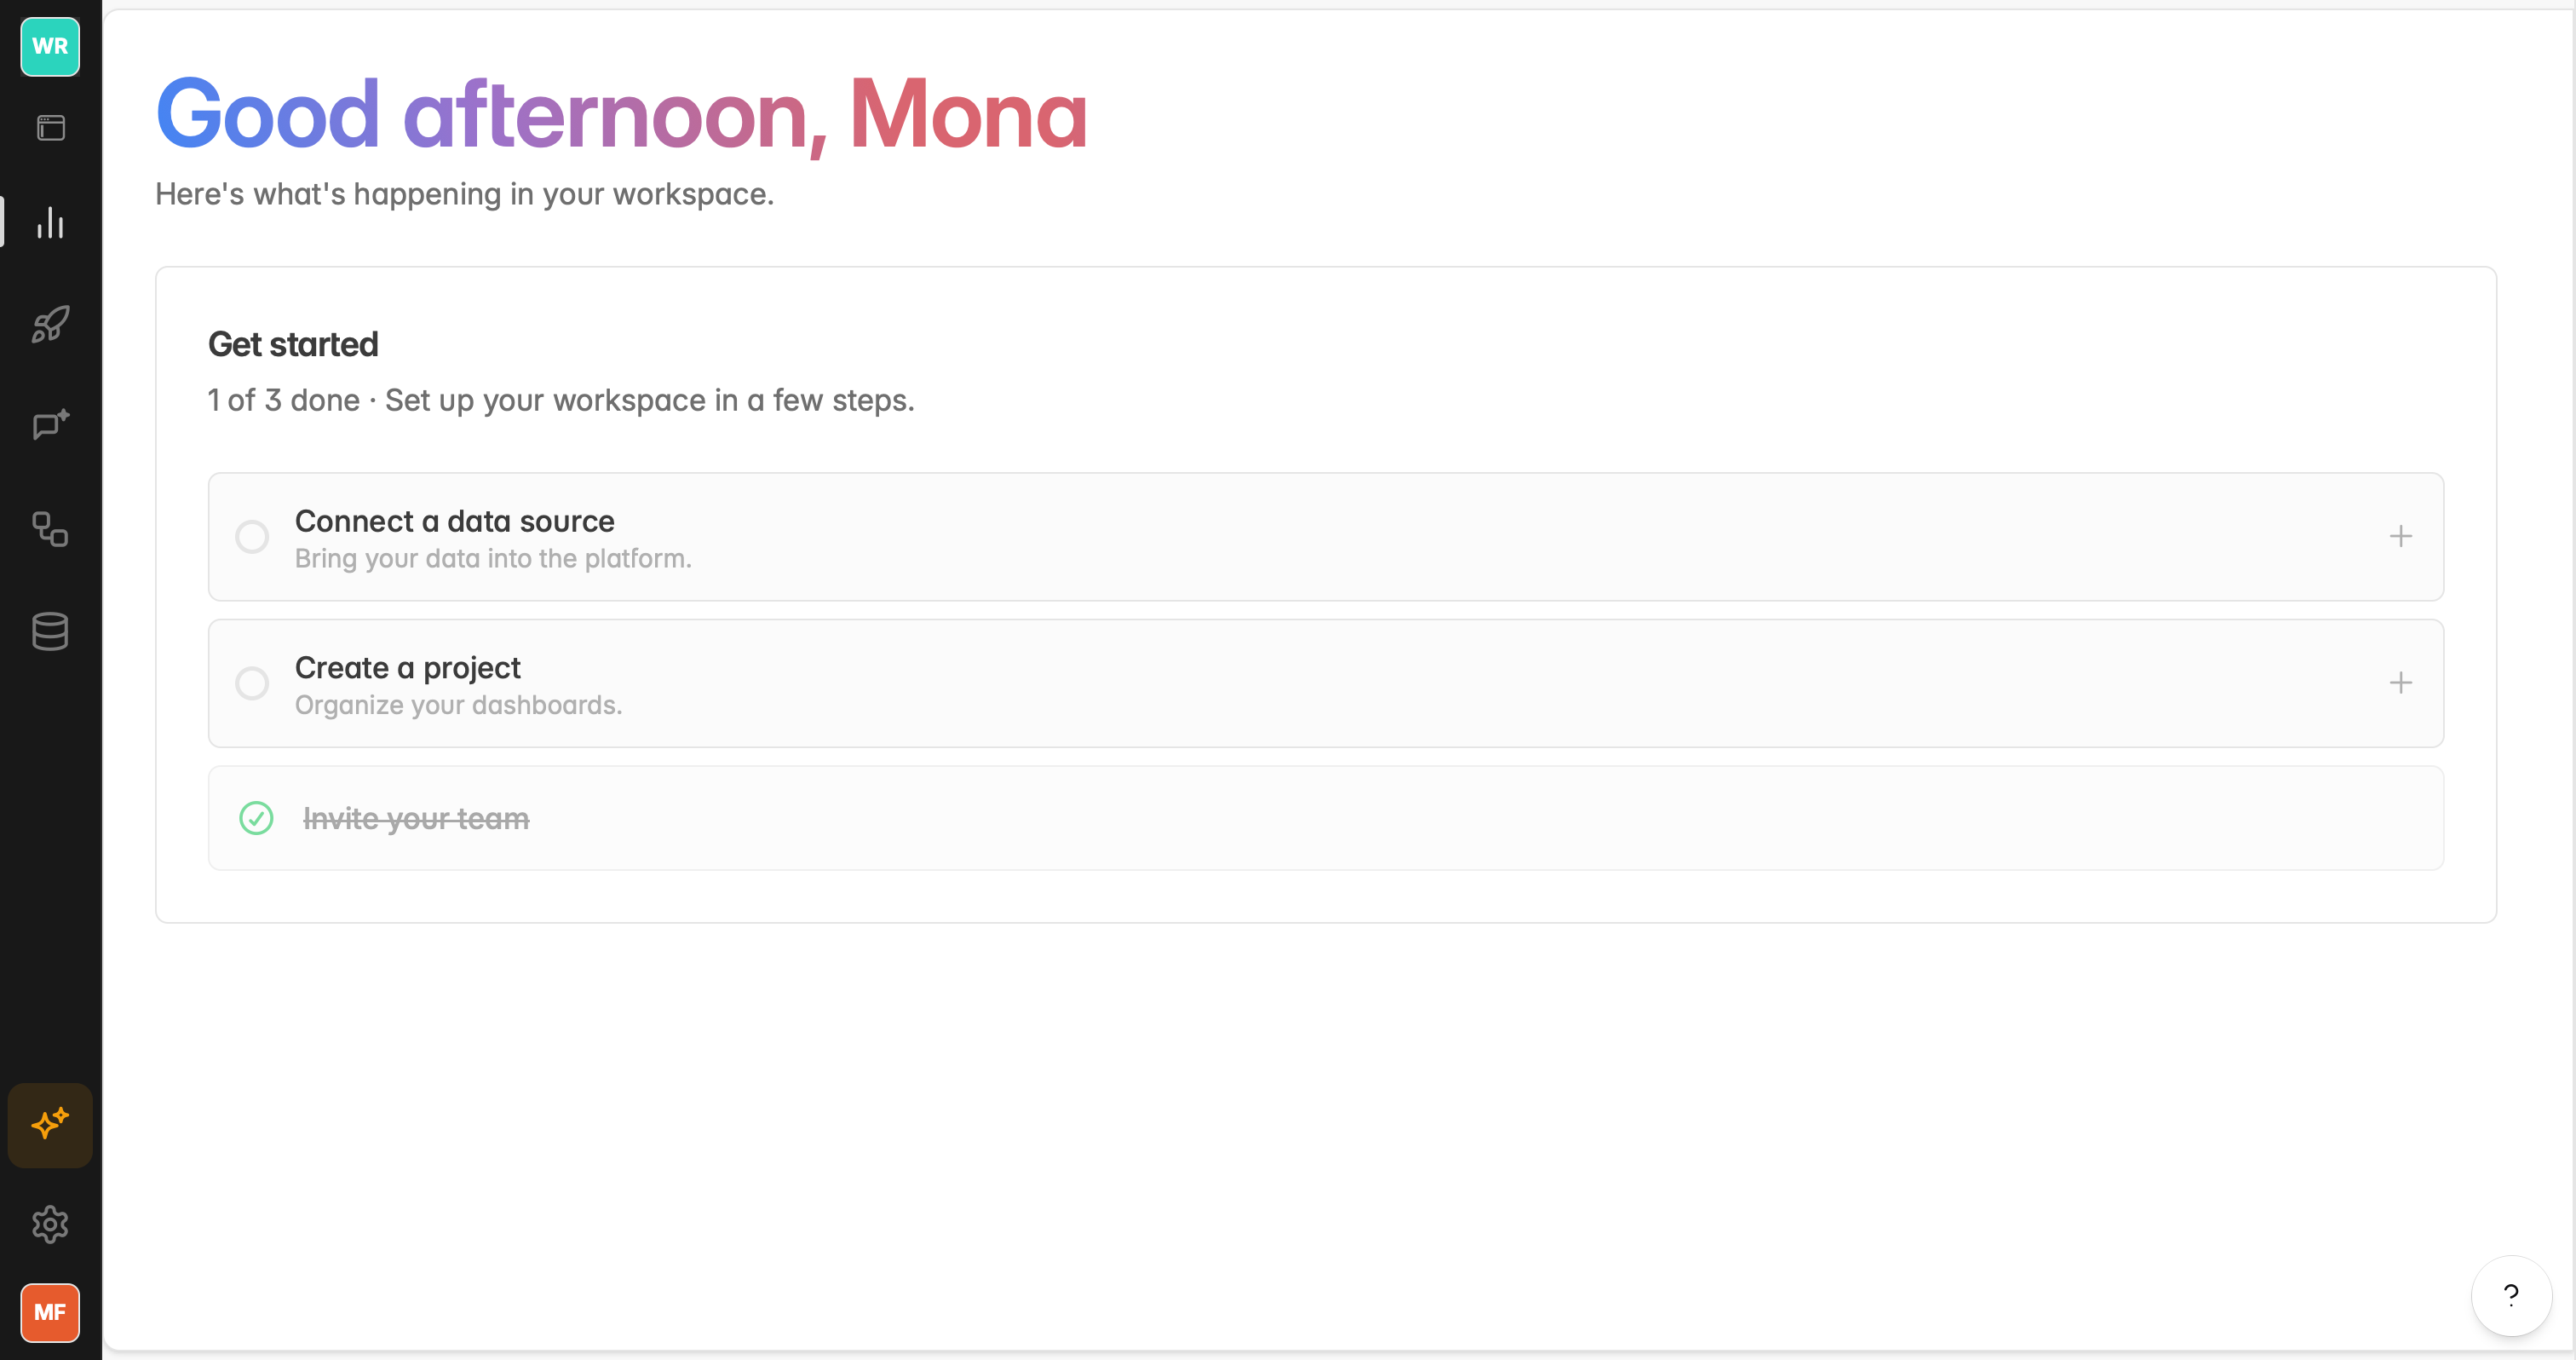
Get Started: Guided Onboarding Checklist
New to Indicate? A "Get started" checklist now walks you through setting up your workspace step by step and shows your progress as you go.
Connect a data source
Create a project
Invite your team
You can find the checklist at the top of your Analytics Home screen until all steps are done.
New Terminology: Clearer Names Across the App
We renamed several core concepts so they are easier to understand. The functionality stays the same, only the names changed.
Data Cube is now KPI.
Data Context is now KPI Collection.
Connections is now MyDataSources.
Connectors now live in the Marketplace.
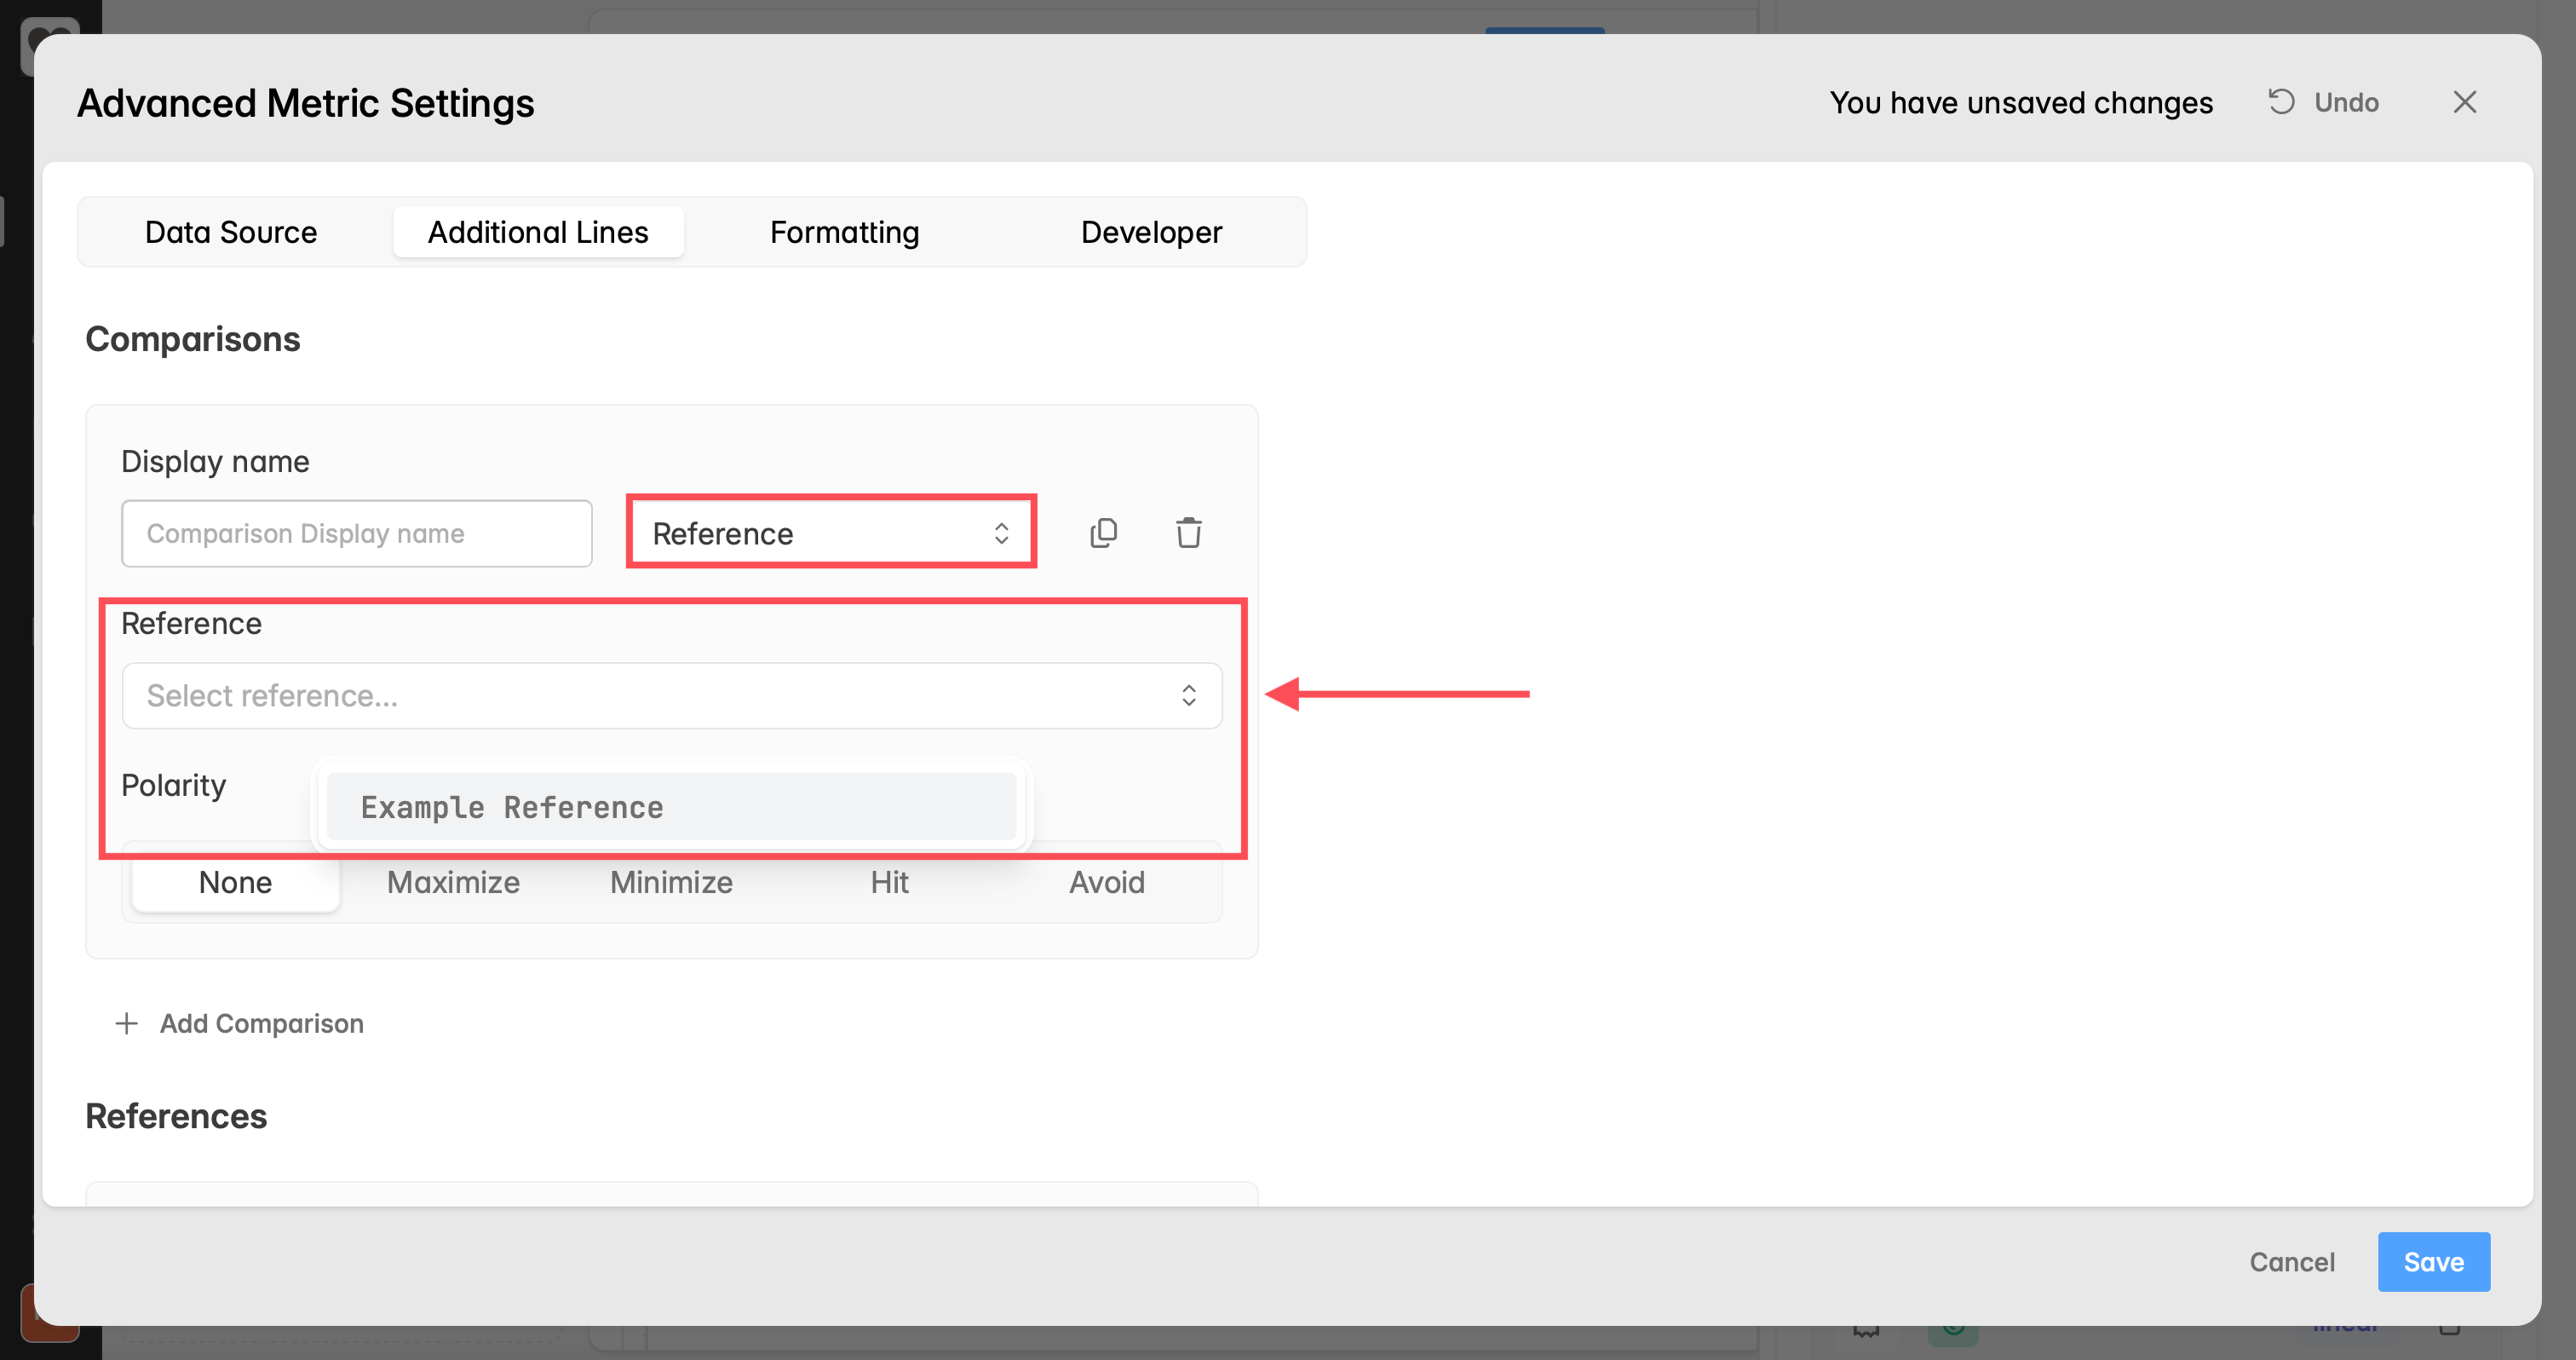
Comparisons: Reference Key as a Dynamic Dropdown
Setting a comparison to a reference line is now much faster. When you compare a metric against a reference line, the Reference Key appears as a dynamic dropdown with automatic suggestions, so you no longer have to copy and paste it by hand. We also unified the wording for the reference field across the Widget Builder, Advanced Metric Settings, and Comparisons.
You can find this in the Widget Builder under Comparisons, when you select compare to a Reference. Of course you need to create a reference line first before it appears in the dropdown.
In App Support: Help Without Leaving Indicate
You can now get help directly inside the product. Browse the docs, and submit feature requests without switching tools. Feature requests are connected to our development workflow, so you get notified automatically once your request is shipped.
You can find this by tapping the small “?” icon in the lower-right corner of the app.
Filter: Not Equal To
Filters now support a "not equal to" operator. For example, show all bookings except those from a specific channel.
You can find this in your filter options in the widget builder.
Pie Charts: Show Labels
Pie charts have a new "Show Labels" option that displays value labels directly on the chart.
You can find this option in your widget settings for pie charts in the widget builder..
Re:Guest Communication Integration: MPE Account Support
Re:Guest Communication Integration now supports MPE accounts.
Advanced Metric Settings: Simplified
The Advanced Metric Settings are now easier to navigate. The "Appearance" tab was merged into "Formatting".
Flying KPIs, Skill Marketplace, Filter: Contains, Calendar update
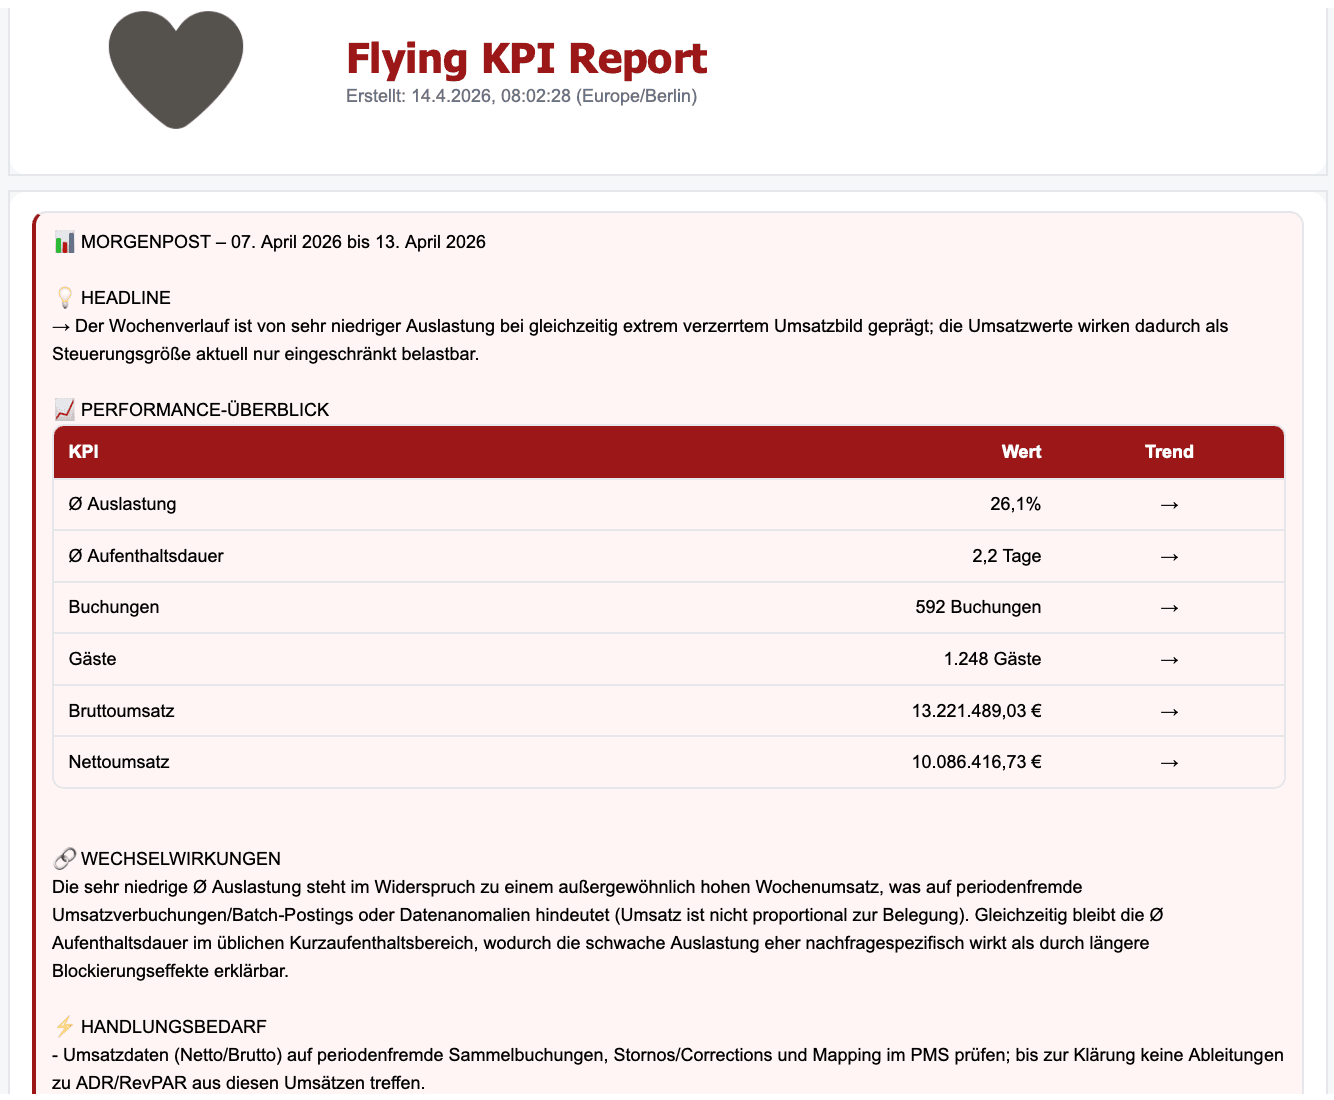
Flying KPIs: Automated Dashboard Reports
Schedule automated dashboard reports and receive them directly in your inbox. Select any dashboard, choose your preferred interval (Daily, Weekly, or Monthly), add your recipients, and optionally include an AI-generated summary of key insights.
You can find Flying KPIs in the left navigation under the rocket icon.
Contains Filter
Filters now support a "contains" operator for matching partial values across text fields. For example, find all campaigns with "Newsletter" in their name. You can find the filter option in your widget designer advanced metric settings.
Skill Marketplace
Our Skill Marketplace is now public. Each skill can be used independently and all three are free. The AI skills cover the full lifecycle of a data file:
data-review: inspect a raw export and get a tiered report on how to clean it for your data warehouse.
data-transform: turn that file into clean, warehouse-ready tables via a rerunnable script.
metric-creator: build DSL-compatible metric and dimension definitions on top of clean data.
The metric-creator is especially useful if you want to build your own metrics directly in Cube Studio. The data-review and data-transform skills are the right choice when you import your own data into Indicate and want to clean it up beforehand.
All three skills work with any AI setup, no matter which AI client you use.
You can find the Skill Marketplace and setup instructions here:
https://github.com/insanetic/data-max/tree/main
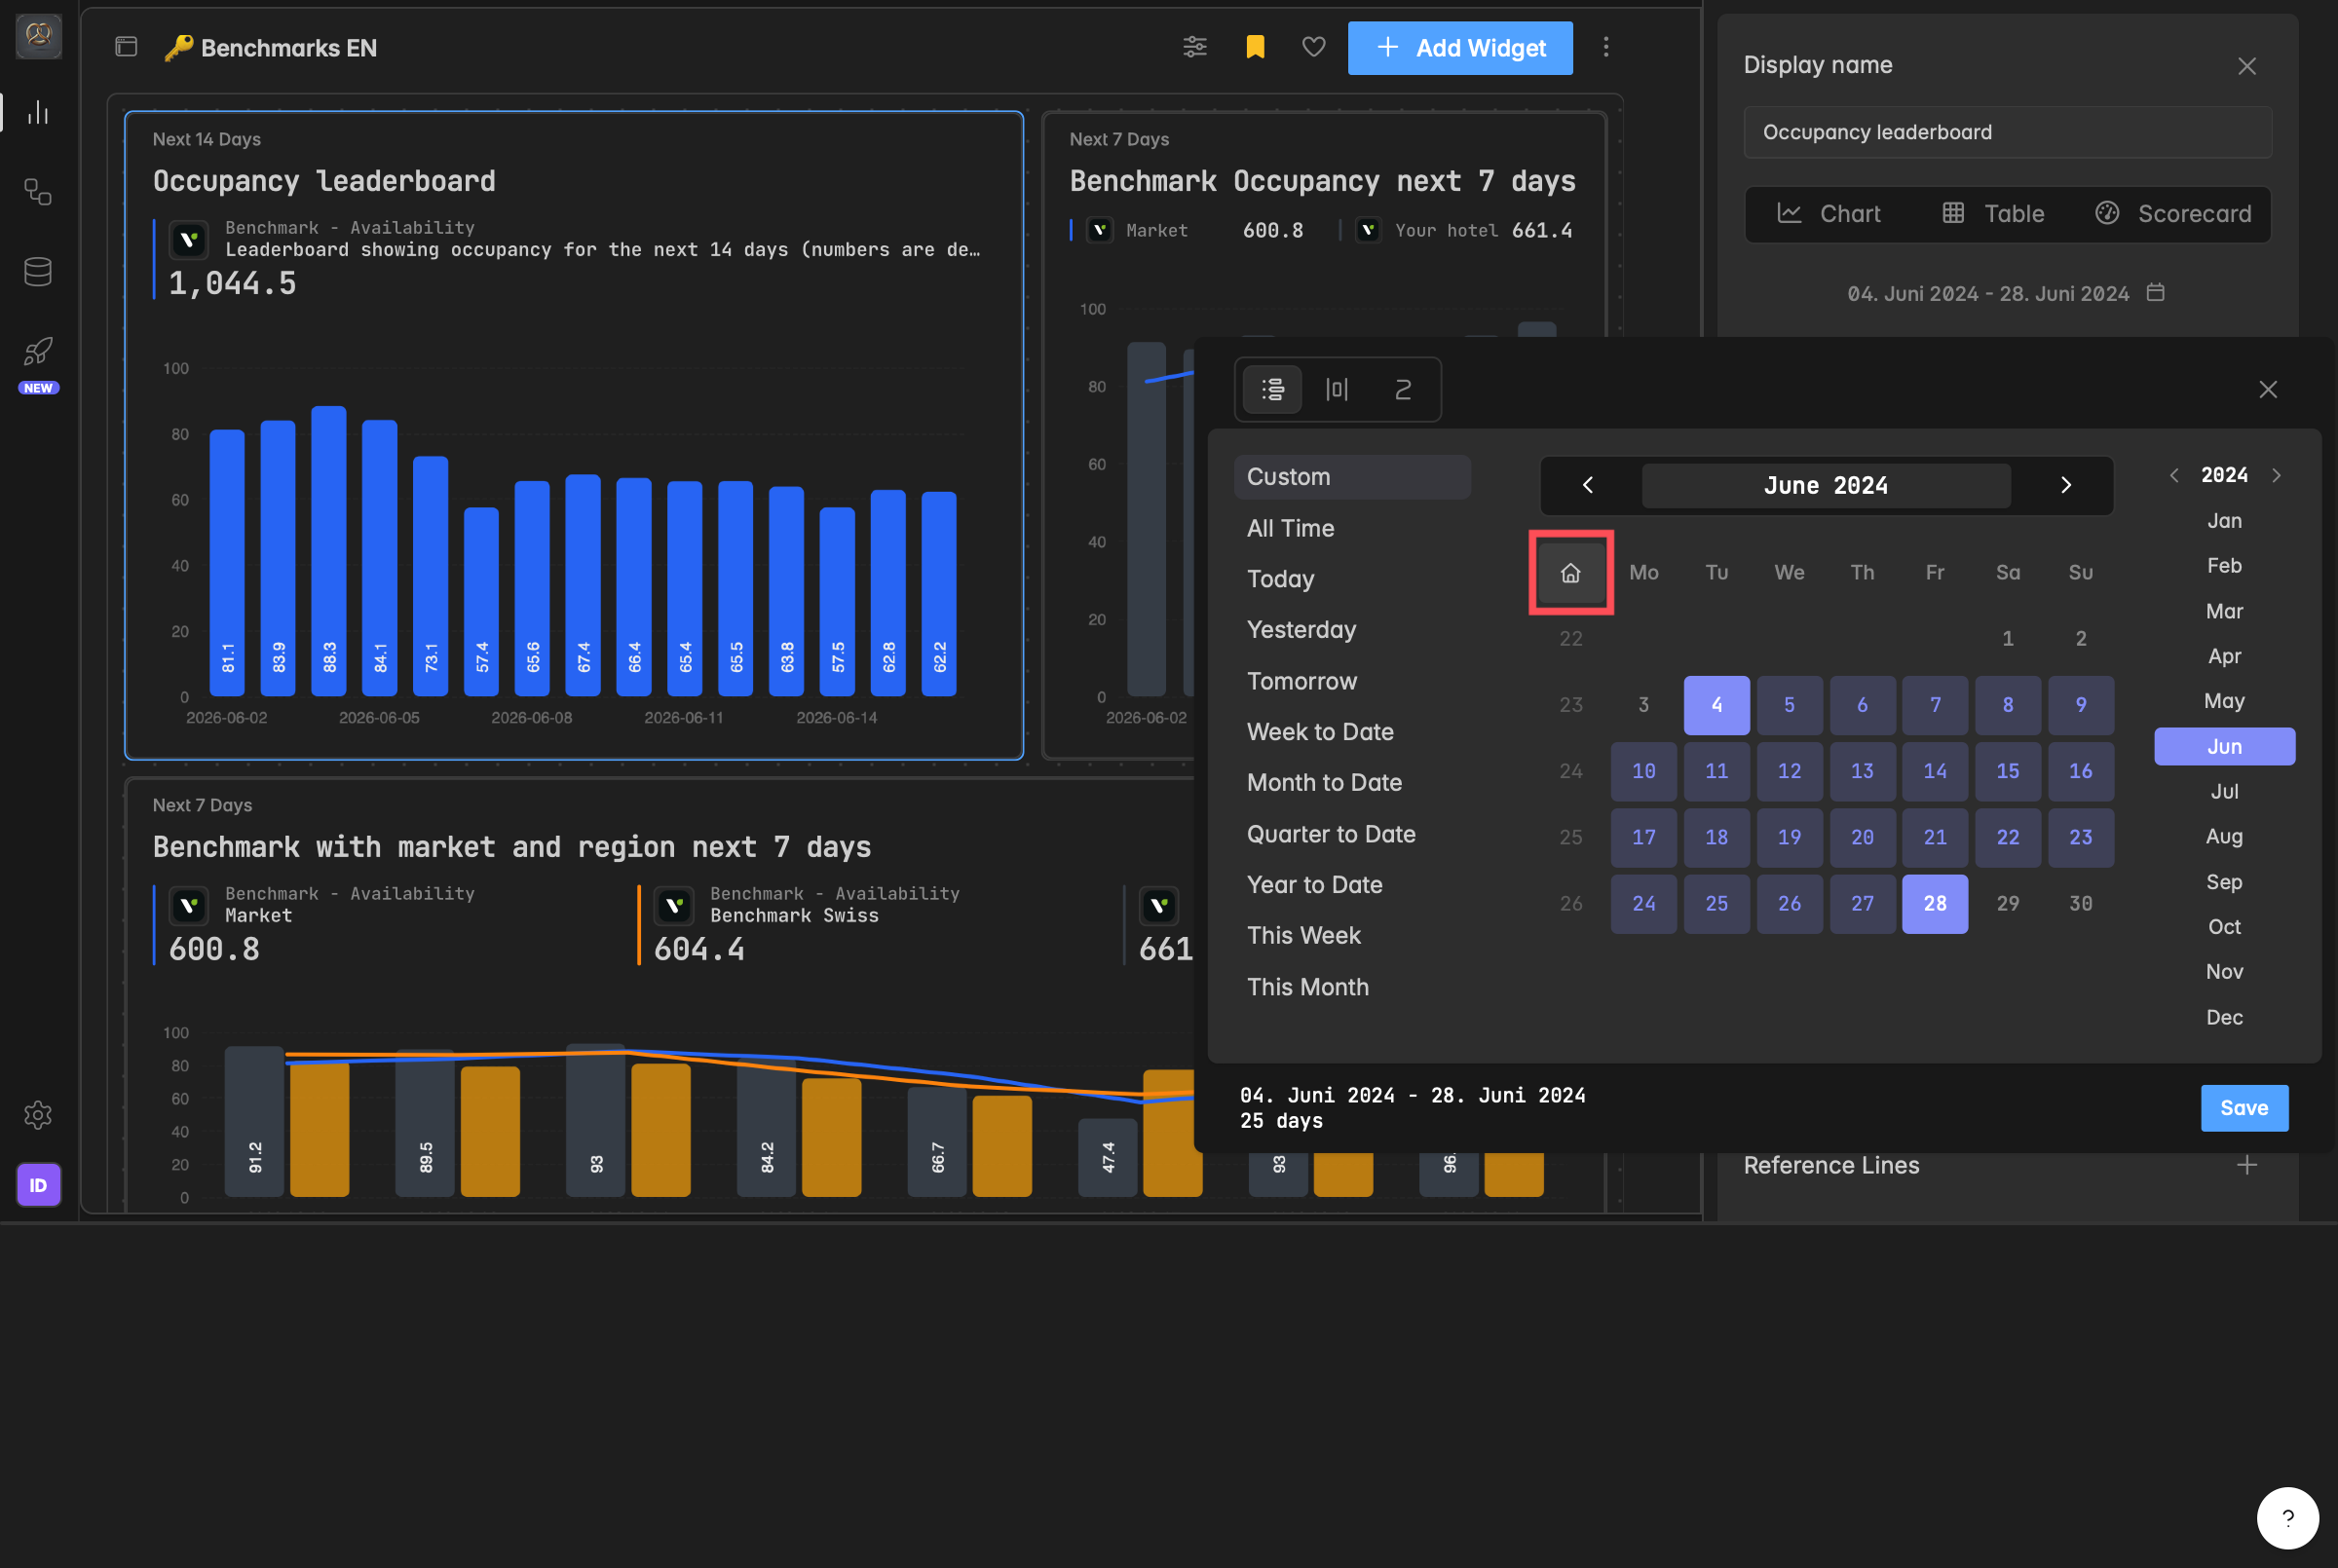
Calendar: New Navigation Options
The calendar has three improvements:
A house icon brings you back to today's date in one click.
New year navigation in the top right lets you jump between years directly.
And a new "All Time" option lets you see your full date range at once.
Re:Guest Communication Integration: New Metrics
Four new metrics are now available for Re:Guest Communication users:
Avg. Booking Rate
Avg. Click Rate
Avg. Interaction Rate
Total Reservations