
Publish a KPI collection as an Insight
Turn a KPI collection from KPI Studio into an Insight, connect it to a source connection, and make its KPIs usable in the app.
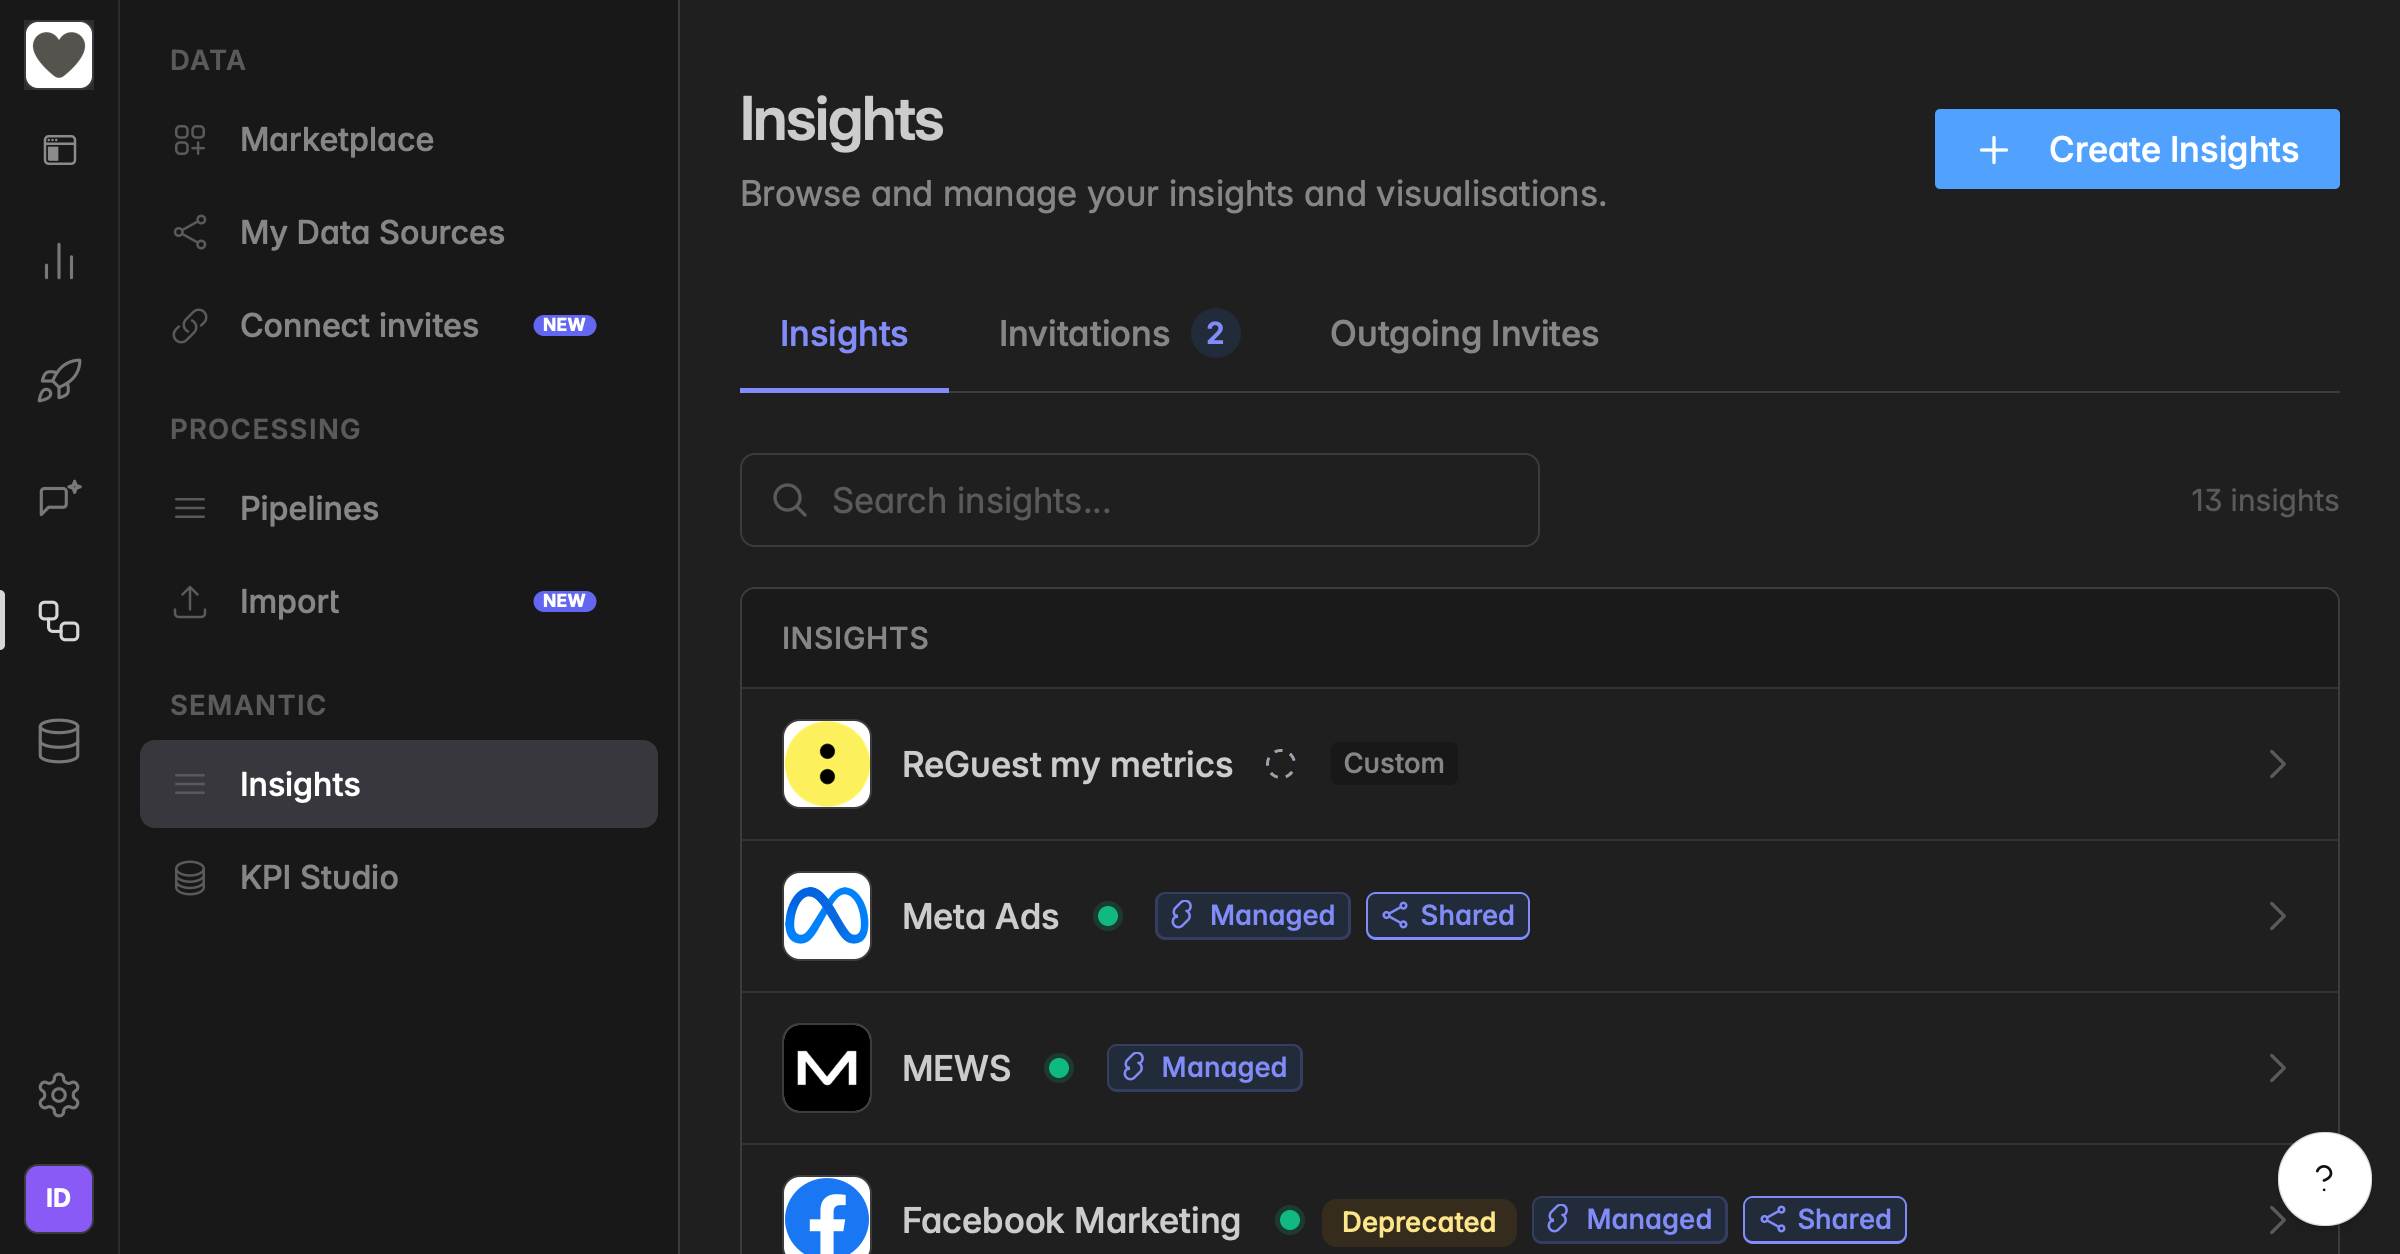
What is an Insight?
An Insight is the published layer on top of a KPI collection. The collection in KPI Studio holds the definitions, the Insight makes them available in your space and connects them to the source connection that delivers the data. You can share the Insights with other spaces.
You find your Insights under Engineering → Insights. Each entry shows the name, the type (Managed or Custom), and whether it is shared.
When do I need this?
You built a custom KPI collection in KPI Studio and want to use its KPIs in dashboards and widgets.
You want to use AI agents to access and analyse your data.
How do I create an Insight from my KPI collection?
Create the Insight after the KPI collection is saved in KPI Studio.
Go to
Engineering→Insights.Click
+ Create Insightsin the top right corner.Click the Display Name field and enter a name, for example
ReGuest my metrics. This is the name users see.Under KPI COLLECTION, click the dropdown and select your collection. Use the search field to find it quickly.
Optional: Under ARGUMENTS, open Select source connection… and choose the connection that delivers the data, for example
Re:Guest Communication.
Arguments let you define variables that are available at runtime or in the declaration of KPI metrics. You can refer to a variable by its name, and its value is then securely ingested at runtime.This is useful for two main purposes:
First, for static values that should not be visible or accessible in the declarations themselves.
Second, for isolating tenants per KPI. A tenant can either be a static value from your system or derived from a dynamic variable based on the connection ID.
Click
Create Insights.
How do I add a logo or product image?
The image is what users see next to the Insight in the list.
Open the Insight and go to the Overview tab.
Under PRODUCT IMAGE, click Upload Image. PNG, JPG, or SVG, max 2 MB.
Click Save Changes.
How do I check that the Insight works?
Open the Insight and go to the Insights tab.
Click the KPI you want to check, for example
Reservations. The entry also shows how many perspectives and dimensions it has.The KPI expands and loads its data.
If the data loads, the Insight is ready to be used in dashboards, widgets and AI.
Troubleshooting
The KPI shows "There was an error loading your data".
Two causes are common. First, no source connection is assigned. Open the Overview tab, set the connection under ARGUMENTS, and click Save Changes. Second, the KPI definition itself fails. Open the collection in
Semantic→KPI Studio, run Dry Run on the KPI, and fix the reported error. See → Build a custom KPI in KPI Studio
My KPI collection is not in the dropdown.
Only collections that exist in your space appear there. Check in
Semantic→KPI Studiothat the collection was created and saved.
The Insight is empty.
The underlying collection has no KPIs yet. Open it in KPI Studio and add a KPI first.
Was this helpful?